What a Good MTTR Benchmark Looks Like for SaaS Teams
Segment your MTTR by severity and deploy cadence to benchmark against what actually matters.

MTTR is not one number. It is four different clocks (detect, acknowledge, repair, resolve), and most teams average them together without agreeing on which one they mean. That single confusion is why cross-team comparisons fall apart and why "our MTTR is two hours" tells you almost nothing on its own. This piece builds a framework for reading your own MTTR against real benchmarks, tied to severity, deploy cadence, and the phase of the incident where time actually disappears.
Start with the math, because the math is where the trouble starts. Total downtime divided by number of incidents gives you a mean. Simple enough. But what counts as "downtime," and what counts as "resolved," differs from team to team and from tool to tool. Some shops stop the clock at deploy. Others stop it at verified fix. A single catastrophic incident can wreck a quarterly average badly enough to bury three months of real improvement underneath it. That is why median matters as much as mean: mean tells you about your worst day, median tells you about your normal day, and a serious team tracks both.
MTTR also has cousins, and mixing them up muddies any benchmark conversation. MTTD (mean time to detect) measures how long before anyone or anything knew something broke. MTTA (mean time to acknowledge) measures how fast someone picked up the page after it fired. MTTR, properly scoped, runs from detection through verified fix, not just from the moment a human noticed. MTBF (mean time between failures) measures something else entirely: reliability, not resilience. A system can have great MTBF and still take four hours to recover when it finally does break. These are different questions with different answers, and conflating them is how benchmark conversations go in circles.
A useful MTTR number has to be pinned to severity tier, deploy cadence, and which phase of the incident lifecycle is eating the clock. That's the argument this piece builds toward, section by section.
What the DORA data actually says about resolution time
The headline number gets quoted constantly: per DORA's 2024 research, elite performing teams keep MTTR under 60 minutes, while low performers average over 24 hours. That gap is real and it's striking. But the data doesn't explain itself. What separates a team that recovers in under an hour from one that takes a full day isn't headcount or raw talent. It's tooling and process, full stop.
DORA's framework rests on four core metrics: deployment frequency, lead time for changes, change failure rate, and time to recover from failed deployments. A fifth metric, deployment rework rate, was added in 2024. Worth noting: DORA's "recovery time" measures failed deployments specifically, not every incident that hits production. That's a narrower scope than most teams assume when they cite the 60-minute figure as a general incident-response target.
Read between the lines and a few things become clear. Teams in the elite tier ship frequently and recover fast at the same time, and the DORA framework tracks both metrics together for that reason. Shipping often without the ability to recover fast is a recipe for compounding risk: each new deploy stacks on top of unresolved fallout from the last one. Neither metric, deploy frequency or recovery speed, does much good in isolation.
The failure-rate side of the picture is sobering. Per a 2025 DORA and Google Cloud survey, only 8.5% of teams hit elite-level change failure rates of 0 to 2%. Meanwhile 39.5% still see failure rates above 16%. So "under 60 minutes" is a ceiling, not a floor. It tells a team where the best in the industry land, not where a team starting from a 24-hour MTTR should set its first-quarter goal.
SaaS-specific benchmarks and why the industry context changes the targets
SaaS incidents don't look like traditional IT incidents. There's no server room, no hardware failing on a rack somewhere. The dominant causes are rapid deploy cycles, third-party dependency failures, and internal misconfigurations, not physical infrastructure. That distinction matters for benchmarking, because it changes what "fast" even means.
The industry benchmark for fast-scaling SaaS companies in 2025 sits at 5 to 15 minutes for minor incidents and under an hour for major ones. Those numbers are tight, and they're achievable specifically because of how SaaS is built. Teams typically own the full stack end to end, without the hardware repair queues or physical infrastructure dependencies that slow traditional IT incident response. Rollback and feature-flag mechanisms can restore service without a full redeploy, which means remediation can happen substantially faster than a fresh build-and-deploy cycle requires. The shared-service nature of SaaS cuts both ways: a single misconfiguration can affect many customers at once, which raises urgency, but it also means one fix can resolve the incident broadly rather than requiring per-customer remediation.
The money behind this is not abstract. For a company running $100M in annual revenue around the clock, downtime costs roughly $190 per minute, according to an OpenObserve analysis. A 120-minute MTTR on that basis costs $22,800 in lost revenue for a single incident. At enterprise scale, the exposure gets much larger: EMA and BigPanda have put the figure as high as $14,056 per minute for the largest organizations. Those numbers are why the 5-to-15-minute and under-60-minute split isn't arbitrary. It's already a severity-tiered benchmark in disguise, and the next section makes that structure explicit.
A severity-tiered framework for reading your own MTTR
There is no single correct MTTR. There's a matrix, with incident severity on one axis and deploy cadence on the other, and a team's real target lives somewhere inside that grid.
For minor incidents, meaning a single degraded service with no customer data exposure and a small blast radius, industry benchmarks place the target at 5 to 15 minutes. Any minor incident that significantly exceeds the 5-to-15-minute benchmark is worth a process review on its own. For major incidents, meaning revenue impact, broad customer reach, or any risk to data integrity, industry benchmarks set the target at under an hour. One to two hours represents a meaningful gap from the under-60-minute benchmark and warrants investigation into what slowed resolution. Past two hours, resolution time has moved well outside the industry benchmark range for major incidents, which points to systemic rather than incidental causes. Critical, all-hands incidents (full outage, an SLA breach on the horizon) deserve their own separate tracking, because time-to-containment matters more here than time-to-full-resolution. Stopping the bleeding and fully closing the wound are different milestones, and blending them into one number hides which one a team is actually slow at.
Deploy cadence changes the math further. A team shipping multiple times a day faces a tighter MTTR requirement almost by necessity, because the next deploy can land before the previous incident is even closed out. High shipping frequency amplifies the cost of slow resolution rather than diluting it.
Applying this in practice starts with segmenting the incident log by severity before calculating anything. A blended average across minor and critical incidents is close to useless for diagnostic purposes; it tells a team nothing about where to actually invest. Compare each tier's MTTR against the targets above, and the tier furthest from target is where attention belongs. Run this quarterly, and track median alongside mean so one outlier incident doesn't distort the read.
What this framework can't tell a team is which phase inside the resolution lifecycle is actually responsible for the gap. That requires breaking MTTR apart into its component phases.
The four phases inside MTTR and where SaaS teams lose the most time
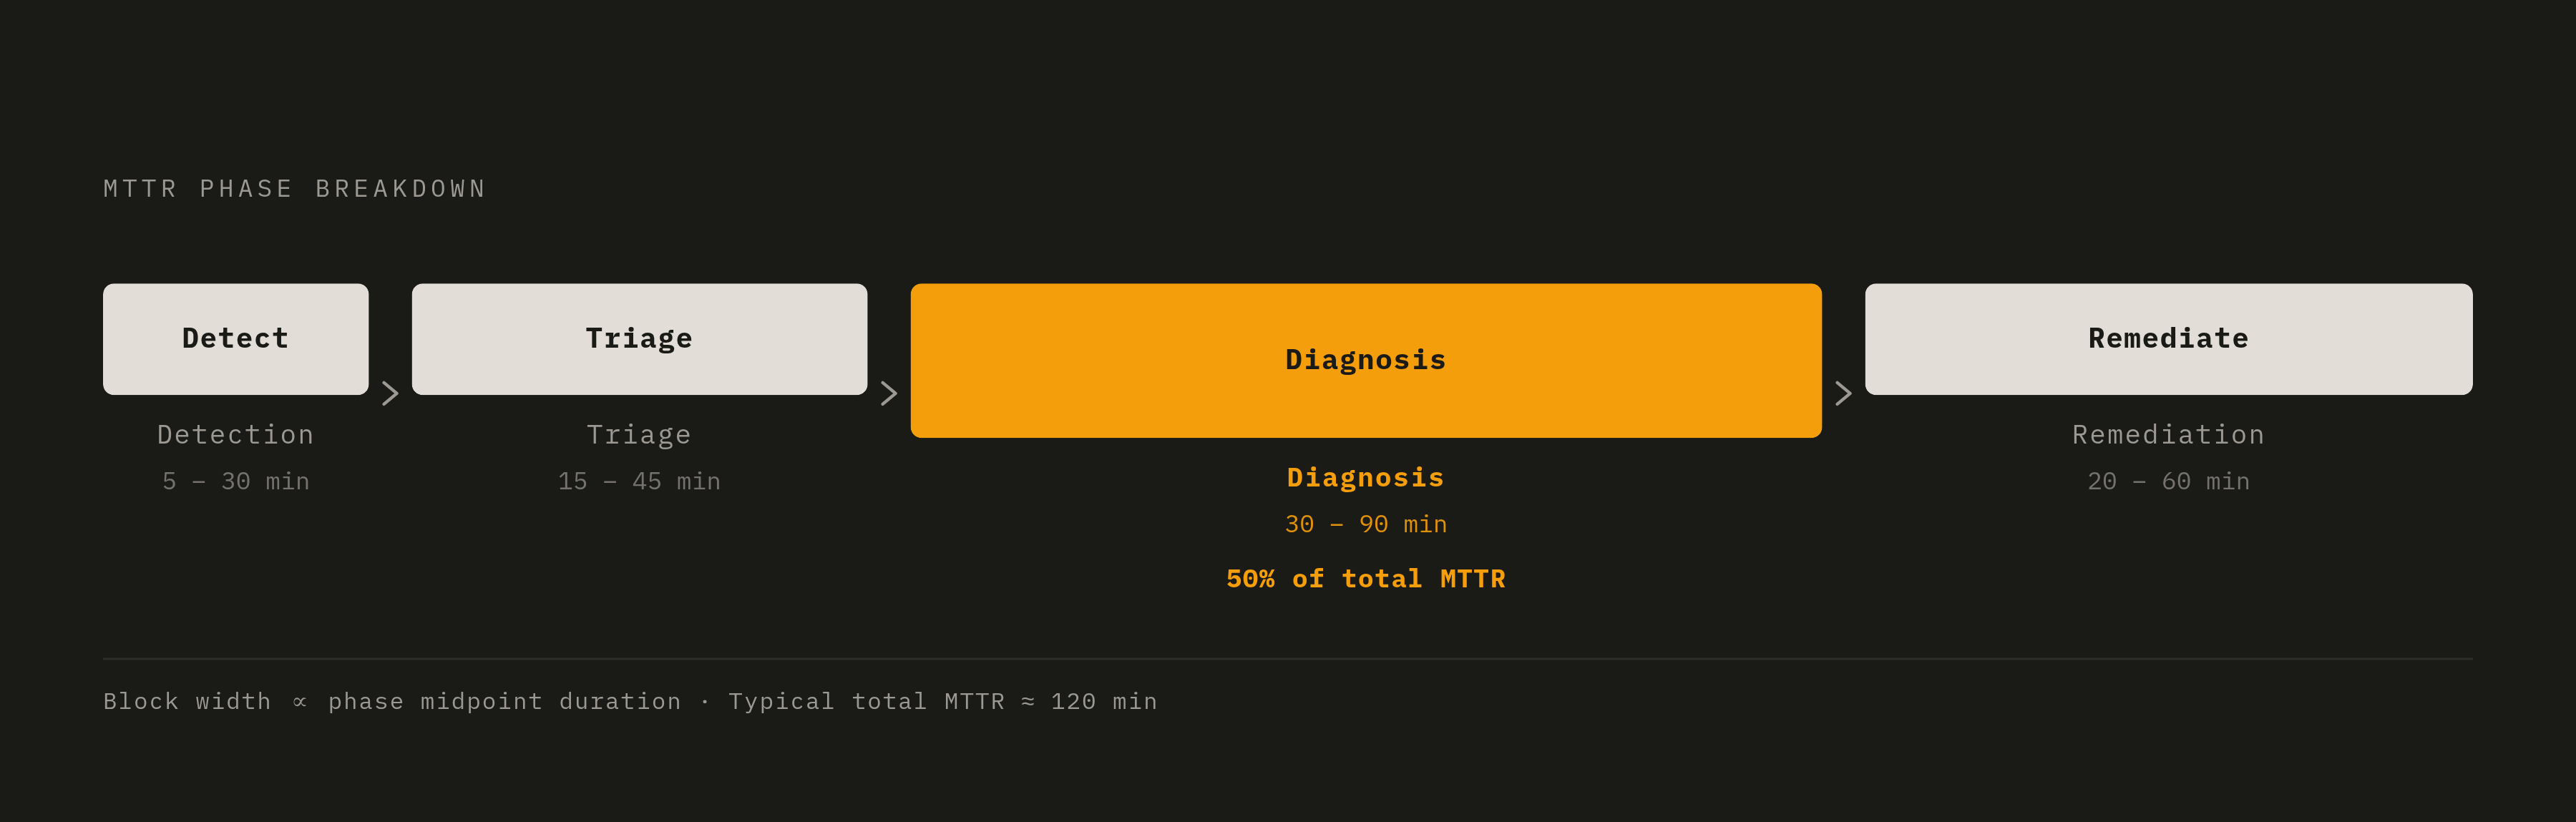
MTTR is a sum of four phases, and each one fails in its own particular way. Detection, in practice, runs roughly 5 to 30 minutes: how long before a system or a human realizes something is wrong. Alert latency, sampling gaps, and thin instrumentation are the usual culprits here. Triage runs roughly 15 to 45 minutes, and it covers confirming scope, severity, and which services are actually affected. The dominant time sink in triage is context-switching across half a dozen different tools trying to piece together a single incident.
Diagnosis is the long one, typically 30 to 90 minutes, and it's where root cause actually gets identified. It's also the phase with the widest gap between elite and low-performing teams, because diagnosis depends heavily on whether the right telemetry already exists or has to be hunted down from scratch. Remediation, the final phase at roughly 20 to 60 minutes, covers implementing the fix, verifying it, and confirming the incident is actually closed. Rollback speed and post-deploy verification gate how fast this phase moves.
Per OpenObserve's analysis, if diagnosis eats 60 minutes of a typical 120-minute MTTR, that's exactly where AI-assisted observability tools deliver the most value. The broader point stands regardless of tooling choice: teams should measure phase time, not just total MTTR, because two teams with identical two-hour MTTRs can have completely different bottlenecks.
The failure patterns by phase are worth naming plainly. Detection fails when there are no post-deploy smoke tests, alert thresholds are set wrong, or sampled traces happen to miss the exact error path that mattered. Triage fails when alert storms hit with no correlation between them, forcing the on-call engineer to open seven different tools just to understand what's actually broken. Diagnosis fails when there's no distributed trace connecting a specific deploy to the regression it caused, or when ownership across microservices is unclear and nobody's sure whose code is even responsible. Remediation fails when a fix ships but never gets verified against real production telemetry, and the incident gets closed before anyone confirms the regression is actually gone.
A team whose diagnosis phase is the bottleneck needs different tools than a team whose detection is slow. The benchmark itself isn't the fix, it's the pointer that tells a team where to look.
How alert noise inflates triage time and what the data shows about its cost
Alert noise is the single biggest problem inside the triage phase. Active DevOps teams commonly deal with thousands of alerts a week, and most of that volume is noise, not signal. It slows response down and buries the alerts that actually matter under a pile of ones that don't.
Three kinds of noise do most of the damage. False positives come from normal system behavior tripping thresholds that were never configured correctly in the first place. Redundant notifications fire multiple times for what is really one underlying issue, multiplying the noise without adding information. Over-sensitive triggers flag minor deviations that don't need a human's attention at three in the morning.
The cascading effect is worth spelling out. Noise forces constant context-switching, and context-switching destroys focus. Real signals get buried under false ones. Mental fatigue during an active incident degrades decision quality exactly when sharp judgment matters most, and sustained on-call overload is a well-documented driver of engineer attrition.
Alert fatigue isn't a culture problem to be solved with better habits. It's a tooling problem, and the fix is structural. Dynamic thresholds that adapt to normal system patterns, instead of fixed values set once and never revisited, cut down false positives substantially. Intelligent grouping presents one unified incident view instead of dozens of separate pings for the same root issue. Deduplication with configurable suppression windows stops the same alert from firing five times in ten minutes. And ownership alignment, meaning the engineers actually responsible for a service manage the alert thresholds for that service, keeps the whole system tuned by the people who understand what "normal" looks like.
None of this shortens the time it takes to fix a problem once it's found. What it shortens is the time to correctly identify what needs fixing in the first place, which is exactly the triage phase that sits before diagnosis even starts.
How post-deploy observability and production verification close the detection gap
A team that checks every deploy against real production telemetry catches its own regressions before a human ever has to be paged. For deploy-correlated issues specifically, that pushes MTTD close to zero, because the system flags the problem before a customer does.
The verification stack that makes this possible works in layers, each one catching what the layer above it misses. Smoke tests run immediately after deploy: lightweight, automated, fast, cheap, and good for catching gross failures within minutes. Synthetic monitoring goes further, running scripted interactions like login, checkout, or search continuously against the live production environment, catching degradation in user-facing flows that a smoke test would never simulate. Automated log analysis scans for spikes in error codes, 500s and 404s, once real traffic hits the new deployment, and groups those errors by likely root cause so diagnosis starts with context instead of a blank page. Feature flags turn remediation from a full deploy event into a runtime configuration change: flip a flag, the feature's off, no redeploy needed, and the remediation phase compresses dramatically as a result.
None of this works without shift-left observability as groundwork. Adding automated observability checks into the CI/CD pipeline, and requiring consistent instrumentation as part of code review, means every change ships with metrics, logs, and traces already attached. When something breaks in production, the telemetry needed for diagnosis is already sitting there waiting, instead of needing to be bolted on after the fact.
Per the 2025 DORA and Google Cloud survey, only 16.2% of organizations hit on-demand deployment frequency, the fastest tier DORA tracks. It's not a coincidence that the same organizations tend to have the tightest post-deploy feedback loops. Fast, safe shipping and tight verification loops move together.
This is the layer where OnePatch operates: sitting between pull requests and the live production environment, checking each deploy against real telemetry automatically, catching regressions without waiting on a human to notice an alert, and opening a fix PR on its own when something breaks. That collapses detection and initial remediation into a single automated step rather than two separate, human-gated ones.
Passing CI is necessary, but it's not sufficient. A deploy that clears every test in the suite can still introduce a regression that only surfaces under real production traffic patterns, the kind no test environment fully replicates. Production telemetry is the only ground truth a team actually has.
What AI changes about root-cause diagnosis, and what it doesn't
AI's clearest use case sits in the diagnosis phase, which is also the slowest and most variable phase of manual incident response. That's where the technology earns its keep, and where the limits of that technology need to be stated honestly.
A defensible architecture for AI-assisted root cause analysis splits the work into two layers. The deterministic layer handles causal graph construction, dependency traversal, and metric anomaly detection, producing findings that are verifiable and auditable after the fact. The generative layer sits on top of that: an LLM interpreting the findings, writing human-readable summaries, and proposing remediation hypotheses. That generative layer adds speed and interpretability, but it is only as reliable as the deterministic layer feeding it.
Meta Engineering has published a two-stage RCA architecture, combining heuristic retrieval with LLM-based ranking, that reaches substantial accuracy at the point an investigation gets created, measured against their own web monorepo. That number is a useful anchor. It says AI-assisted root cause analysis performs meaningfully better on incidents that resemble known patterns than it does on genuinely novel failure modes, and 42% is nowhere near good enough to hand the diagnosis phase over entirely.
The real value in that number isn't replacement, it's narrowing. Cutting the search space down from thousands of candidate causes to a small handful is a serious accelerant, even when the final call still needs a human engineer. There's a broader case for automation's value here too: Ponemon Institute's 2025 Cost of a Data Breach study found organizations using AI and automation extensively saved roughly $1.9 million per breach and cut the breach lifecycle by 80 days. That figure comes from security incident response, not SaaS uptime, but the underlying logic transfers cleanly: automation shortens the window that a failure, or an attacker, has to compound.
Fixed runbooks still handle known failure patterns well. Agentic workflows that gather context and propose the next investigative step earn their keep on the unknown cases runbooks can't cover. The practical architecture uses both, not one instead of the other.
The agentic development risk that makes MTTR benchmarks more urgent, not less
The 2025 DORA Report found something that should give every engineering leader pause: AI adoption improves throughput, but it increases delivery instability at the same time. The likely mechanism is volume. AI writes code faster than a team's review process and deployment infrastructure were ever built to absorb.
That's the trap. Code generation speed has decoupled from the human and automated systems responsible for verifying that code before it reaches production. More pull requests, more deploys, more surface area for regressions, all arriving faster than the review and observability layer was designed to handle. In that environment, an MTTR benchmark built for a slower, more human-paced deploy cadence stops being aspirational and starts being existential. A team that can't detect and fix regressions in minutes, rather than hours, is a team that will fall behind the pace of its own code generation.
That's the case for treating MTTR benchmarking as urgent now, not eventually. The gap between elite and low-performing teams was already wide before agentic development entered the picture. Faster code generation without a matching investment in post-deploy verification does not close that gap. It widens it.