Mean Time to Detection in Production Engineering
Undefined terms and loose calculations hide the real cost of slow incident detection.
Mean Time to Detection sounds like a settled term, but it isn't. Ask three engineering leaders how they calculate it and expect three different formulas back: some start the clock when telemetry first shows a symptom, some start it when an alert fires, and some don't start it until an engineer actually confirms something is broken. That gap between definitions is not a footnote. It shapes staffing arguments, vendor contracts, and how much a company thinks it can afford to spend on observability.
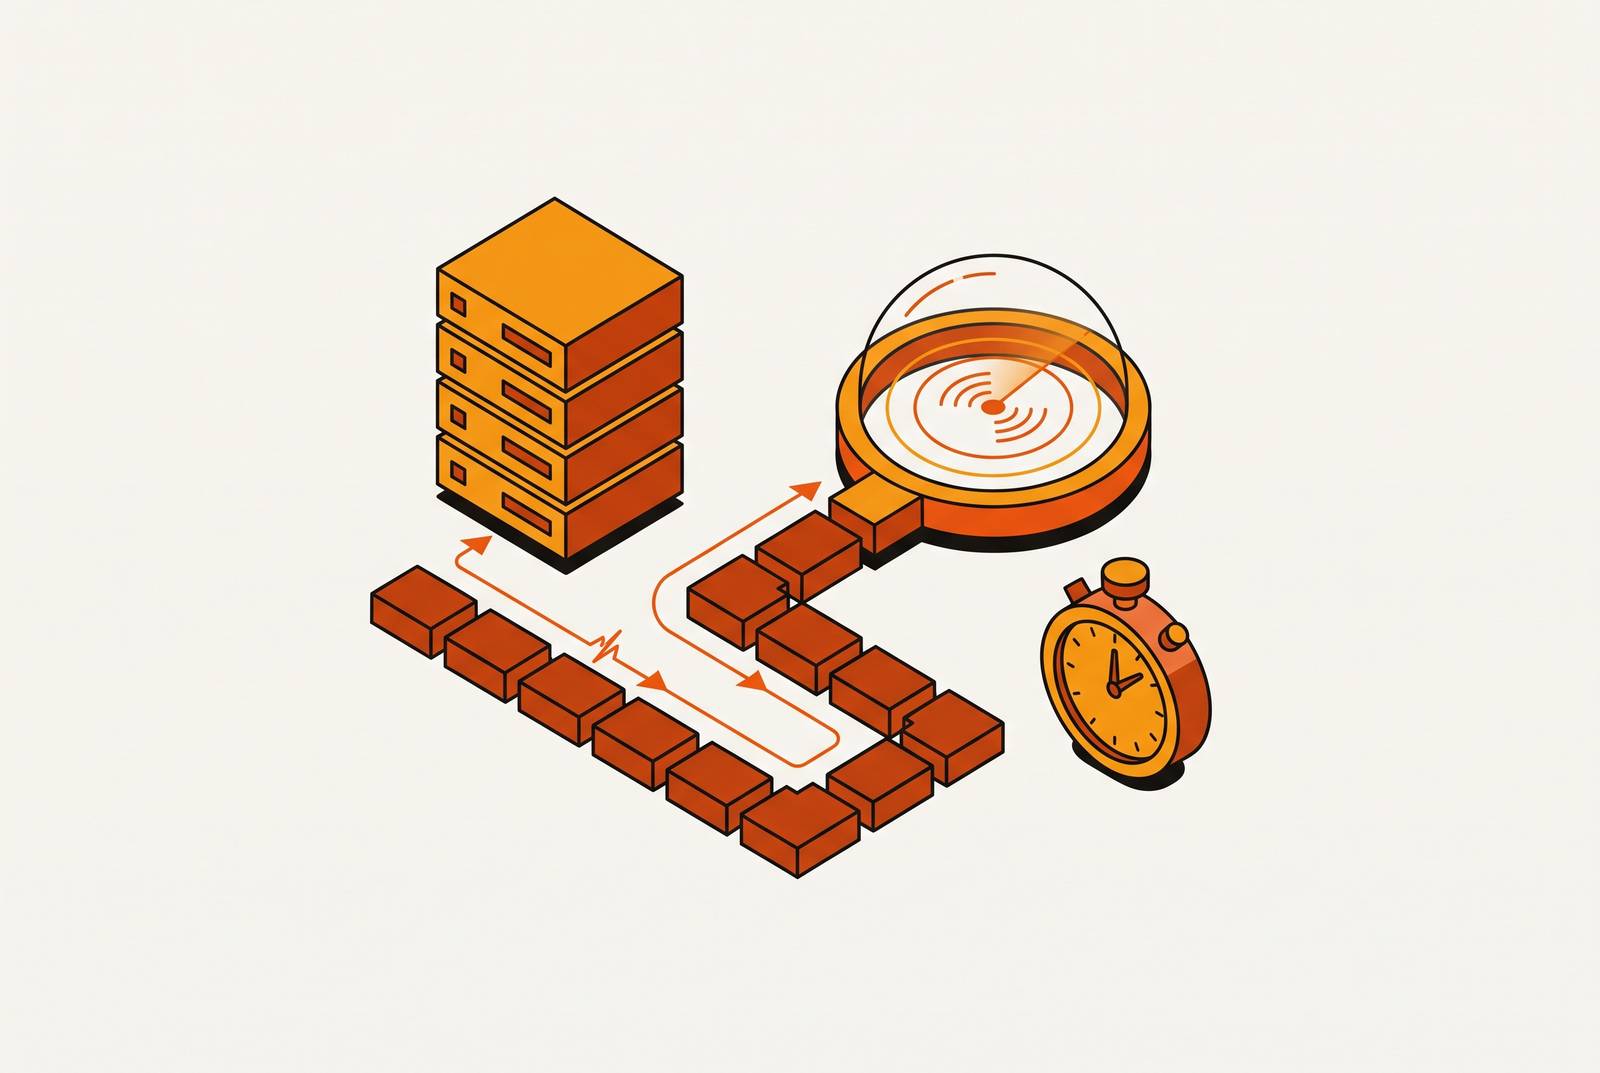
The formula itself is simple. Add up the detection delay for every incident (the time between when a failure actually started and when someone confirmed it), then divide by the number of incidents. Ten issues that together account for 30 hours of undetected lag work out to a 3-hour MTTD. Simple math, but the number only means something if everyone agrees on what "detected" means. MTTD sits upstream of Mean Time to Acknowledge and Mean Time to Resolve, and it's the gating step in that chain: nothing downstream gets faster until detection stops the clock. The real subject here is the detection gap itself, the span between a failure first showing up in telemetry and a human actually confirming it. MTTD is supposed to measure that gap, but loose definitions just hide it.
What bad MTTD actually costs — moving from abstraction to budget line
ITIC's 2024 Hourly Cost of Downtime report found that more than 90% of mid-size and large enterprises put the cost of one hour of downtime above $300,000, and 41% put it between $1 million and over $5 million. Separately, industry figures peg the average cost of downtime at roughly $9,000 per minute. Those numbers aren't abstractions. They're what's ticking while MTTD sits inflated and nobody's noticed the failure yet.
Every extra minute added to detection time is a minute where that per-minute cost keeps running with nobody watching the meter. The logic compounds in a predictable direction: slow detection stretches out resolution time, a longer resolution window lets the failure spread further, and a bigger blast radius means a bigger bill once the incident finally closes out. MTTD isn't just one metric among several; it's the multiplier sitting in front of every other number in the incident lifecycle.
Framed that way, cutting MTTD stops being an engineering nice-to-have and starts looking like a straightforward cost argument, one with a dollar figure attached to every minute saved.
The four structural forces that push MTTD up regardless of team effort
None of what follows is a people problem. These are structural conditions built into how modern production systems work, and no amount of individual diligence fixes them on its own.
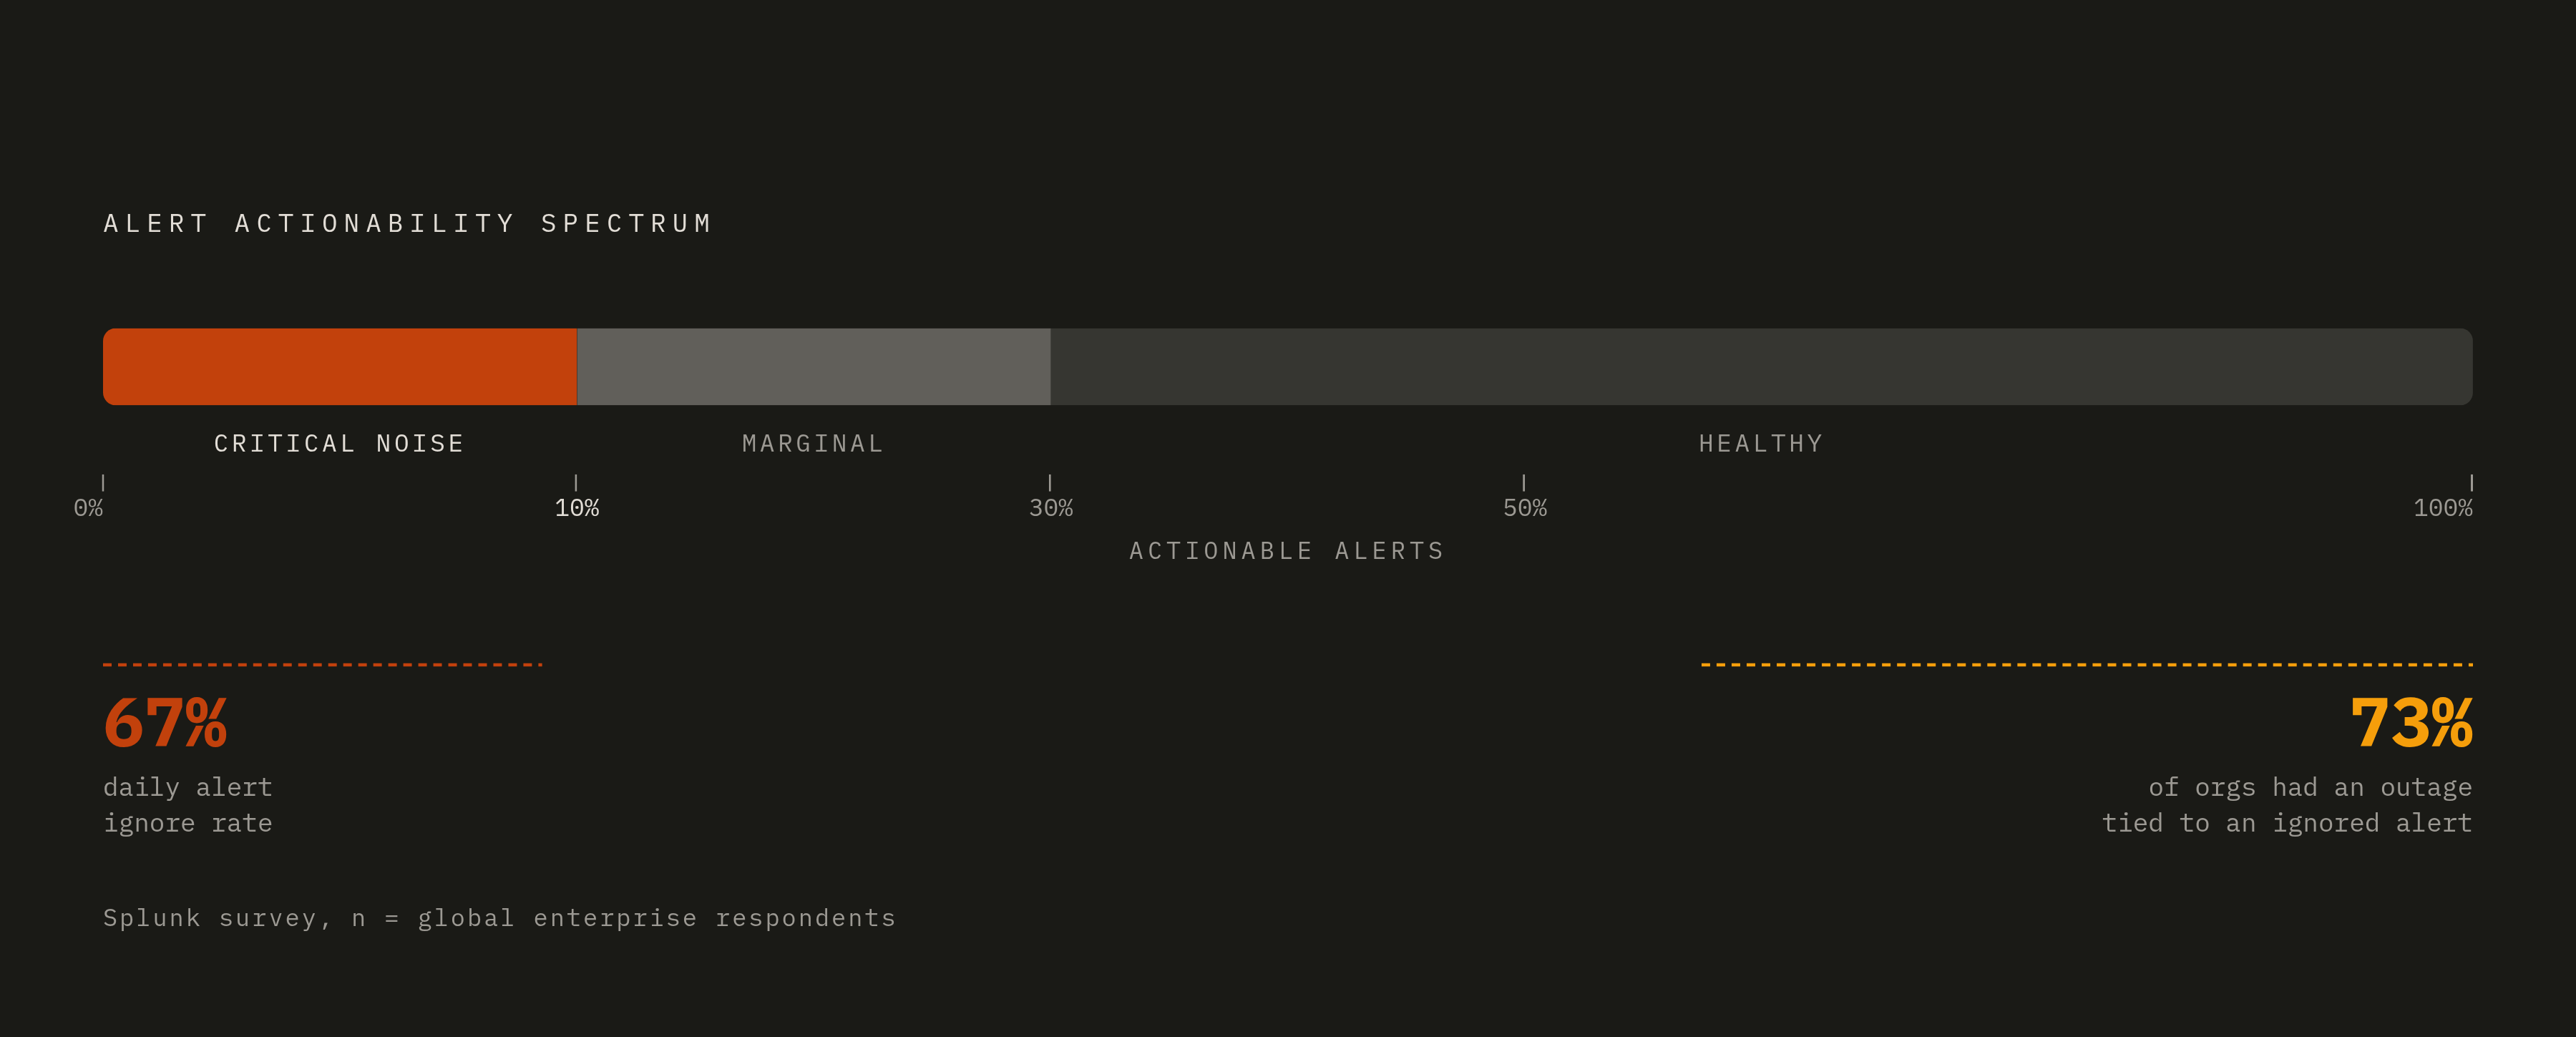
Alert noise is the first and most obvious. Real signals get buried under a pile of low-value ones, so the failure sits visible in telemetry well before anyone notices or acts. Splunk's 2025 State of Observability report, surveying 1,855 organizations, found that 73% had experienced an outage tied directly to an alert that got ignored. Separate industry analysis puts the daily ignore rate as high as 67% of all alerts generated.
Tool sprawl compounds the problem. When telemetry lives across a handful of disconnected systems, engineers have to manually stitch together a picture that should already exist in one place. Every extra tool an engineer has to open mid-incident is time the failure keeps running unconfirmed.
Then there are the visibility gaps: the failures that were never instrumented at all. In those cases, a customer support ticket becomes the detection mechanism, which is about as far from MTTD as an organization can get without admitting it. The distance between what's actually instrumented and what's actually failing is where MTTD quietly balloons, often without anyone noticing until a postmortem forces the question.
Last is plain system complexity. Production today spans applications, services, infrastructure, and network layers, and a failure can hide behind any one of them. A symptom that surfaces in the application layer might have its root cause three layers down in infrastructure, and nothing about that relationship is visible by default.
One nuance worth holding onto before moving on: a fast MTTD only proves someone saw a symptom. Speed without comprehension doesn't solve the incident, it just relocates the delay downstream into MTTR.
Alert fatigue as a direct MTTD tax — and what a healthy signal-to-noise ratio looks like
Alert noise breaks down into a few recognizable patterns. False positives come from thresholds set too tight or from normal system behavior misread as anomalous. Redundant notifications fire multiple times for what is, underneath, a single root cause. Over-sensitive triggers flag deviations too minor to require any action at all. All three do the same damage: they teach engineers to stop trusting the alert queue.
There's a useful diagnostic buried in the actionable-alert rate. If fewer than 10% of alerts an on-call engineer receives require actual action, the system is drowning in noise. Healthy alerting setups tend to land in the 30% or higher actionable range. Most teams have never actually measured where they sit on that spectrum, which means the first real step toward fixing alert fatigue is just running the numbers.
The cost of noise goes well past detection speed. Context-switching mid-investigation wrecks focus at exactly the moment focus matters most. Mental fatigue produces worse decisions during the incidents that actually count. And the human cost is real: engineers who've been paged into exhaustion tend to leave, and the institutional knowledge they carry walks out the door with them.
The trend data backs this up. In 2025, 78% of developers reported spending at least 30% of their time on manual toil, a meaningful share of it alert-related overhead. Catchpoint's 2025 SRE Report, based on a survey of 301 respondents, found operational toil climbed to 30% from 25%, the first increase in five years. This is a step in the wrong direction, and it's happening at a moment when teams can least afford it.
None of this requires a new platform to fix. Deduplication rules that consolidate alerts pointing to the same root cause, machine-learning-based grouping of related signals, and a cleanup pass on routing rules so alerts land with the right responder instead of the wrong one: these are changes most teams can make with tools already in place, and they tend to produce a visible drop in noise almost immediately. Once alerts are actually trustworthy again, responders stop hesitating before acting on them. That hesitation, multiplied across a team, is exactly what's compressing or inflating both MTTD and MTTA.
Why CI passing is not a detection mechanism — the post-deploy visibility gap
CI/CD pipelines test what code does inside a controlled sandbox. They cannot replicate real user traffic, real data volume, or the actual state of every downstream dependency at the moment a deploy goes live. The instant a pull request merges and ships, the test suite goes dark, and the only source of truth left is whatever production telemetry reports back.
Most teams still treat the window between "deployed" and "confirmed working" as manual, human-paced time. Someone watches a dashboard for a while, or waits to see if anyone complains. That gap is unstructured, and unstructured time is exactly where MTTD quietly grows.
A handful of mechanisms close that gap. Smoke tests run lightweight, automated checks against core functionality the moment a deploy finishes, cheap to run and fast enough to catch a bad deploy before it turns into an incident. Synthetic monitoring scripts real user flows, like a login or checkout sequence, and runs them against the live environment on a schedule, surfacing degradation before an actual customer hits it. Real-time log analysis watches for spikes in error codes, 500s especially, as traffic starts hitting a fresh deployment, giving the first concrete signal that something's wrong at the code level. Chaos engineering goes further still, deliberately injecting faults into production, the way Netflix's Chaos Monkey or Amazon's GameDay exercises do, to confirm resilience mechanisms actually hold before a real failure finds the weak point on its own.
The deeper fix is shifting observability left: building instrumentation requirements into code review itself, requiring a predefined set of metrics and distributed traces for every new feature before it ships, and adding automated observability checks directly into the CI/CD pipeline. The goal is that every change arrives with visibility already attached, rather than bolted on after an incident forces the question.
This is the exact gap OnePatch is built to close. It verifies every pull request against real production telemetry after deployment, catching regressions before a human ever needs to be paged, and it opens fix pull requests on its own when something breaks. Production verification stops being an afterthought and becomes the default state.
What observability investment actually returns — and where the gaps remain
The 2025 State of Observability report found that 78% of enterprises using observability tooling report 30% faster incident resolution and 25% better uptime. The business case for investing in observability isn't speculative anymore; it's documented. Gartner has projected that 60% of Fortune 500 companies will prioritize observability investment by 2027, targeting MTTR reductions as high as 50%. The market has already made its decision.
But buying observability tooling and actually achieving observability coverage are two different things. Most teams instrument the happy path in detail and leave failure paths thin or untouched. Distributed tracing coverage is frequently incomplete, with spans dropping at service boundaries and leaving holes in the picture right where a cross-service failure would show up. Log analysis, meanwhile, is only as good as the logs feeding it; plenty of legacy services still produce unstructured logs that resist any kind of automated parsing.
There's an honest ceiling here worth naming directly. Observability tells you what happened, but it does not tell you why, and it can only ever report on the systems someone actually instrumented. The real question for any team evaluating its own setup isn't whether it has a monitoring stack. It's what percentage of the actual production surface area that stack can see.
How AI-generated code at agent speed changes the MTTD problem
Harness's 2025 State of Software Delivery survey, covering 500 respondents, found that 92% of developers believe AI coding tools have increased the blast radius of bad deployments. That number alone should reframe how teams think about detection.
The reasoning is straightforward. Agents can generate and ship code faster than any human review cycle can keep pace with, which means more deploys per day, and more deploys per day means a higher chance that any given detection window is the one catching a real regression. Errors, bad configurations, or manipulated outputs move fast across interconnected systems, often faster than a team can notice before the damage compounds. Among organizations that have deployed AI agents, 88% reported at least one security incident in 2025.
Trust is moving in the opposite direction from adoption. Global trust in fully autonomous AI systems dropped from 43% to 27% in 2025, even as organizations continued deploying them. That's a real contradiction: more AI-generated code shipping into production, with less confidence in what it's doing once it gets there. Automated verification is the only thing that closes that contradiction rather than just living with it.
There's also a detection blind spot specific to AI workloads. Standard metrics like latency, error rate, and throughput don't capture model behavior at all; a model can return a clean 200 OK response while producing an output that's flatly wrong. Prompt-completion linkage, multi-agent workflow tracing, and the reasoning path inside a black-box model are all gaps that traditional monitoring wasn't built to see. OWASP's 2025 agentic top-ten list names Agent Goal Hijack, Tool Misuse, and Memory Poisoning as high-severity risks, and none of them shows up on a standard APM dashboard. Deploy an AI agent without full logging of its prompts, responses, and actions, and there's no forensic trail left when something goes wrong.
The fix looks a lot like observability discipline applied to a new category of behavior: OpenTelemetry-compliant AI observability that logs sanitized prompts, responses, tool calls, and agent decision paths. Research into AI agent failures attributes 61% of all agent failures, combined, to scope creep and data quality issues. Both are detectable categories, provided the right signals are actually being captured.
How AI-assisted detection and automated incident response compress the detection window
Here's the other side of the same coin. IBM's 2025 data shows organizations using AI and automation in their security operations cut breach lifecycle by 80 days and saved $1.9 million per incident on average. The same technology that expands blast radius when deployed carelessly compresses detection time when applied with intent.
The difference between AI-assisted detection and traditional rule-based alerting is a difference in kind, not degree. Rule-based systems match against known signatures; if a failure doesn't look like something seen before, it doesn't trigger anything. AI-driven detection instead generates and tests hypotheses against live telemetry, system topology, and incident history in real time. That distinction matters most exactly where agentic code creates the most risk: novel failure modes that don't match any signature on file.
The examples on record are concrete. Organizations applying AI-assisted detection to real incidents have reported meaningful compression of resolution timelinesn from an estimated two hours to 28 minutes. At SREcon25 EMEA, Solo.io's Peter Jausovec presented an AI Reliability Engineering framework that cut incident resolution time from four hours down to eight minutes. Broader studies show AI-assisted approaches cutting MTTR substantially, and faster root-cause identification doesn't just shrink the fix time, it narrows the detection-to-confirmation gap too.
The logical endpoint of all this isn't just faster detection, it's closing the loop entirely. Spotting a regression quickly is necessary, but it isn't sufficient on its own if a human still has to open a terminal and start digging. The most advanced systems skip that handoff and open a reviewed fix pull request automatically the moment a regression is confirmed.
This is where OnePatch operates: verifying every pull request against real telemetry, catching regressions before a human ever gets paged, and opening fix pull requests without waiting for someone to pick up the incident manually. Detection and resolution stop being a relay race between tools and people and become a single automated pipeline instead.
A practical framework for systematically reducing MTTD
Measurement comes before optimization, always. A team cannot reduce a number it hasn't precisely defined, and MTTD is one of the most commonly miscalculated metrics in production engineering specifically because that definition step gets skipped.
Start by deciding, in writing, exactly where the clock begins: first telemetry signal, alert generation, or engineer confirmation. Pick one and apply it consistently across every incident, every team, every postmortem. Without that consistency, MTTD isn't a metric, it's a rough impression dressed up in a number.
From there, the earlier sections of this piece double as a checklist. Measure the actionable-alert rate and get it into the 30% to 50% range before touching anything else. Audit instrumentation coverage against actual production surface area rather than trusting that a monitoring stack implies full visibility. Add post-deploy verification, smoke tests, synthetic checks, real-time log scanning, so the moment between "deployed" and "confirmed working" stops being unstructured dead time. And where AI-generated code is entering the pipeline at agent speed, match that speed with automated verification rather than trying to review it at human pace.
None of these steps are exotic. What they require is discipline: define the metric precisely, measure it honestly, and treat every structural force pushing it upward as something to be engineered around rather than tolerated.