MTTR Mean Time to Resolution vs Mean Time to Detection
Detection and resolution measure different problems that need different fixes.

MTTD and MTTR get used as if they're one metric with two spellings. Mean Time to Detection measures how long a problem exists before anyone knows about it; Mean Time to Resolution measures how long it takes to fix once someone does. These are sequential clocks: a team cannot start resolving an incident it hasn't detected, which means the two numbers have entirely different causes and entirely different fixes. If a team's total incident duration is long, the real question is whether the time is bleeding out before the alert fires or after it, because those two failure modes live in different parts of the org and respond to different tools entirely.
Worth clearing up early: the "R" in MTTR gets read four different ways across the industry, repair, recovery, respond, resolve, and each one measures a different stopping point. This piece uses "resolution," meaning the root cause is permanently addressed rather than just patched over. DORA's 2023 shift toward calling this "Failed Deployment Recovery Time" is a sign the field is trying to sharpen what it means, but "MTTR" remains what engineers say out loud, so that's what gets used here.
The full incident lifecycle that sits between the two metrics
"Detect, then fix" is a summary more than a pipeline, and summaries don't tell you where the time actually went. The real sequence has more stages, and naming them precisely is what makes diagnosis possible instead of guesswork.
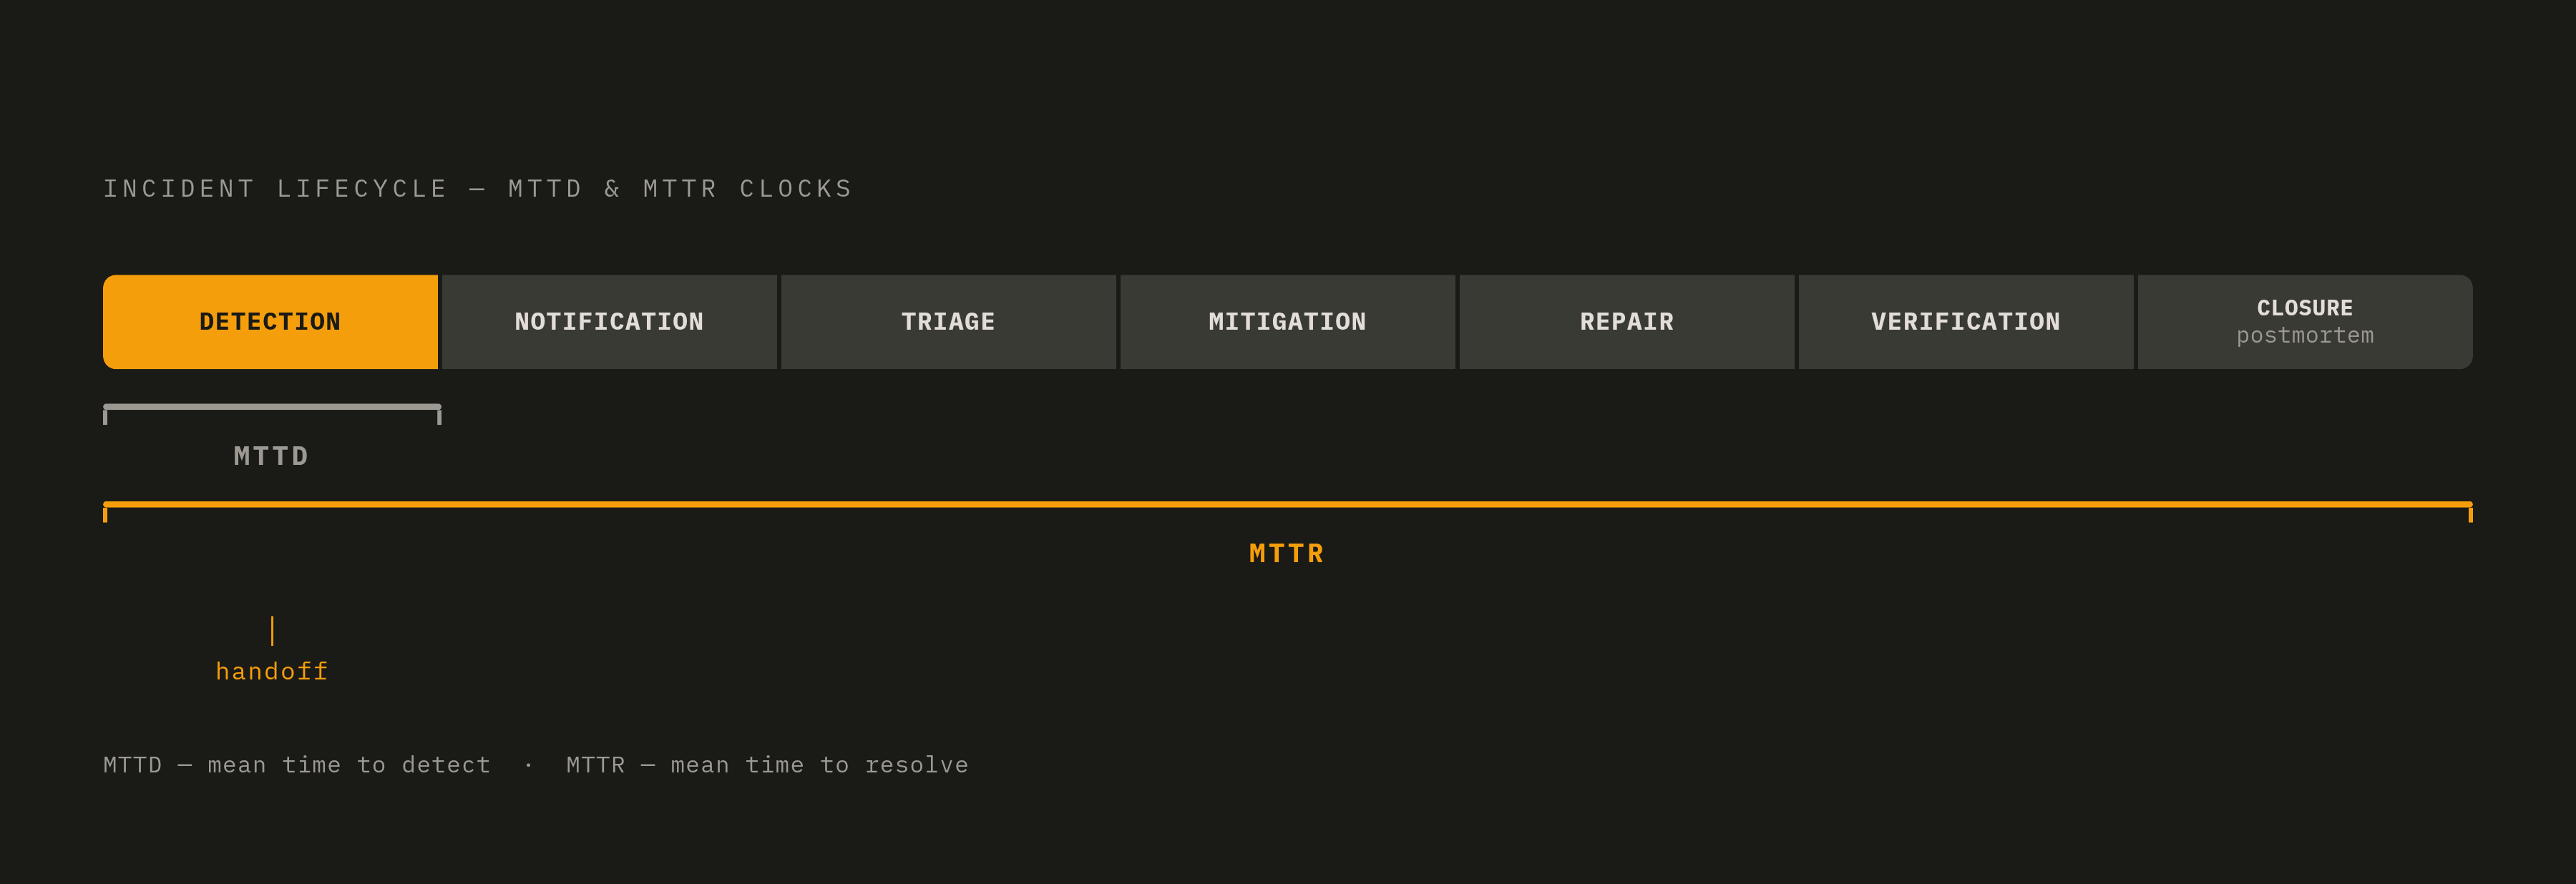
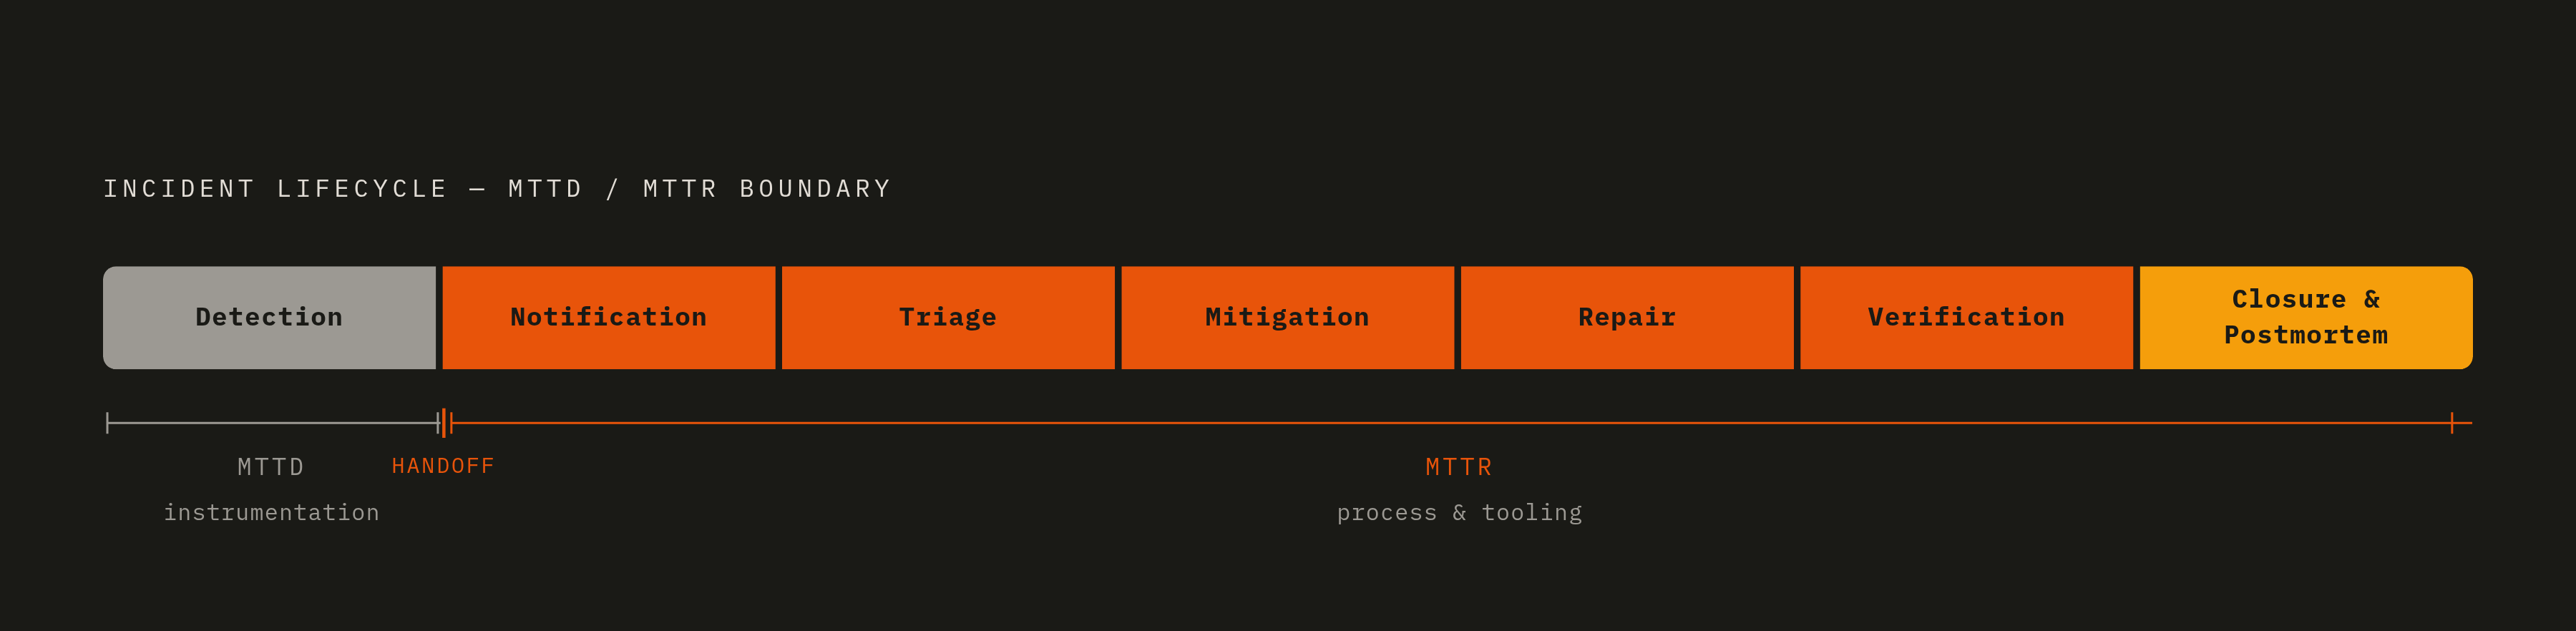
Detection comes first: monitoring, or a user, surfaces that something is wrong. This is where MTTD ends. Notification follows, the alert routes to whoever's on call, through a pager, a chat ping, an incident channel. Triage comes next: someone figures out what's actually broken, how bad it is, and what severity to call it. Mitigation is the tactical stop-gap, flipping a feature toggle, shifting traffic, rolling back a deploy, anything that stops the damage without touching the underlying cause. Repair is the real fix: the code change, the infra patch, the config correction, the data restore. Verification checks that the fix actually held, using telemetry and health checks rather than a gut feeling, and it's the stage most often skipped when everyone just wants the incident closed. Closure, the postmortem, wraps it up with a timeline and assigned action items.
MTTR in the resolution sense spans the full interval from when the incident is known through when it is permanently resolved. The sub-variants, repair time, recovery time, response time, each stop at a different point in that chain, which is exactly why two teams comparing "our MTTR is three hours" often aren't measuring the same interval at all. Worth naming separately: MTTI, Mean Time to Investigate, which helps isolate whether triage specifically is where things stall.
Skipping verification carries its own risk, since an incomplete fix guarantees the next incident starts sooner than it should have. A fix that didn't fully hold just becomes tomorrow's fresh alert.
Where detection actually fails: the gap between "something broke" and "someone knows"
Mandiant's M-Trends 2025 report put the median global dwell time, the stretch between when an intrusion starts and when it's found, at 11 days, with the range running from hours to months depending on the nature of the incident and the organization involved. That's a security number, but the underlying dynamic isn't limited to security incidents: problems exist in production well before anyone's aware of them, and that gap tends to run longer than teams assume.
A Cisco Live 2025 survey of 319 IT professionals found something that should unsettle any team that trusts its dashboards: more than half, 50.8%, said they find out about performance problems when an employee reports it to IT or the help desk, rather than from monitoring or an alert. The signal comes from a person, typing a ticket, because something felt slow.
Put those two data points side by side and the pattern is plain: coarse health checks and polling-based monitoring leave real gaps, and human complaint-filing fills those gaps by default, which is a slower and less reliable detection mechanism than any team would choose on purpose.
A few things tend to drive this. Alerts get built around lagging indicators, CPU load, memory usage, instead of what users actually experience, error rate, latency. Services with no structured logging or tracing produce no signal at all when they fail, because there's nothing watching for the failure to show up in. Engineers, tired of noisy alerts, mute them, and muting doesn't discriminate between the noise and the one alert that mattered. Most pipelines have no dedicated check after a deploy goes out, so a regression introduced by a PR sits silent until a user happens to hit it.
The upshot: fixing MTTD is mostly an instrumentation problem, a question of signal quality, rather than a staffing question or a matter of how fast people respond. The fix sits upstream of the alert, not downstream of it.
Alert noise as a detection quality problem, not a volume problem
More alerts don't mean faster detection. If the signal-to-noise ratio is bad, a flood of alerts just teaches engineers to stop reading the queue, and that learned habit quietly inflates MTTD even when the monitoring itself looks thorough on paper.
Three things tend to drive that noise. False positives, alerts tripped by normal, expected behavior or by thresholds nobody's tuned since setup. Redundant notifications, the same underlying failure triggering a stack of separate alerts, a single bad deploy setting off 34 individual pages is a documented pattern, not a hypothetical one. Over-sensitive triggers, alerts firing on deviations too small to warrant anyone's attention.
Healthy teams see something like 30 to 50% of their alerts turn out actionable. Drop below that 30% floor and the alert system has effectively turned into noise infrastructure, generating volume without generating information. Splunk surveyed 1,855 organizations and found 73% had experienced an outage tied directly to an alert someone ignored. Ignored alerts aren't a side effect of noise; they're the exact mechanism by which noise turns into downtime.
Fixing this means alerting smarter rather than alerting less. Tune thresholds against a service's actual historical behavior instead of leaving vendor defaults in place. De-duplicate and group related signals so one incident produces one page with full context, not 34 separate ones. Use suppression windows during planned maintenance so expected noise doesn't compete with real signal. Favor anomaly detection over static thresholds where the traffic pattern is irregular. Assign alert ownership to the engineer who owns the service, so alert definitions get maintained by someone with a stake in them being right.
There's a trust cost buried in all this too. Once an on-call engineer has learned to distrust the queue, even a properly tuned alert has to fight through that skepticism before it gets acted on.
What actually stretches MTTR once detection has happened
The Cisco Live 2025 survey of 319 respondents found that more than 80% said resolving a problem takes anywhere from several hours to a full week.
That gap between elite and average is a story about tooling and process more than individual skill. Engineers burn time context-switching across separate observability tools trying to piece together one incident, and every extra tool opened is time the SLO clock keeps running. Without high-cardinality traces and logs to work from, diagnosis becomes a guessing game, form a hypothesis, wait to confirm it, try the next one, which serializes work that should be happening in parallel. Mitigation stalls when there's no pre-approved playbook for the failure type in front of someone. A ready fix sits in a PR queue waiting on ordinary review instead of getting fast-tracked. Verification gets skipped too often, the incident gets closed on a feeling rather than confirmed telemetry, and the same problem reopens days later.
Tool sprawl is a specific, measurable tax on top of all this. Gartner research found organizations running a single, consistent observability stack remediate roughly 40 to 50% faster than those coordinating incident response across multiple vendors, because every extra tool is a context switch, a login, a different query language to remember under pressure.
There's a similar gap between company sizes. Ponemon Institute data from 2024 found enterprises with dedicated security and SRE teams resolve incidents 30 to 40% faster than mid-market organizations. Expertise plays a role, but a fair amount of that gap is really a proxy for better tooling and clearer runbooks, not raw talent.
How automation changes the economics of both clocks
MTTD and MTTR respond to different kinds of automation, and conflating them means applying the wrong fix to the wrong clock. MTTD improves when verification happens automatically right after a deploy, a PR merges, ships, and its telemetry gets checked against baseline behavior immediately, so a regression trips an alert before a user ever notices. MTTR improves when triage gets automated, when incident context arrives already correlated, and when a fix arrives as a pre-staged PR for a human to review rather than something an engineer has to write from a blank file under pressure.
IBM's 2025 Cost of a Data Breach Report found organizations running AI across their security workflows cut 80 days off their breach lifecycle and saved an average of $1.9 million per breach compared to peers without that automation. On triage specifically, AI-driven alert correlation has cut triage time from a range of 15 to 45 minutes down to under 5, by collapsing what would have been 34 separate alerts into a single incident with the context already attached.
The goal here is cutting out mechanical toil, the log-searching, the manual correlation, so engineers spend their time on judgment calls instead, not full autonomy. Restarting a production database or issuing a bulk rollback still deserves a human's sign-off.
There's a real paradox worth naming here: operational toil actually rose in 2025, up 30%, the first increase in five years, even with 51% of organizations running some kind of AI initiative. That tells you deploying an AI tool and wiring it into the actual incident response workflow are two different problems, and solving the first doesn't solve the second. Automation sitting outside the response pipeline doesn't compress either clock, no matter how sophisticated the model behind it is.
The clearest version of automation done right closes the detection gap and the repair gap in the same motion: every PR gets automatically checked against real production telemetry after it ships, and when a regression shows up, a fix PR gets opened autonomously for review. That single mechanism touches both MTTD, because the regression gets caught before a user does, and the repair phase of MTTR, because the fix is already drafted by the time an engineer looks at it.
What agentic development does to both metrics if verification isn't automated
90% of DORA's 2025 survey respondents say they use AI in their work, and most think it makes them more productive. But roughly a third also admit they don't fully trust the code that AI generates, a strange pair of beliefs to hold at once, and it says something about where the real risk is sitting.
Gartner projects that by 2026, 40% of enterprise applications will include task-specific AI agents, up from under 5% in 2025. That's a steep curve, and it means code volume and deploy frequency are set to climb faster than human review capacity can keep up with. Agentic pipelines push more changes into production, faster, and if there's no automated verification sitting after deployment, MTTD grows in proportion, because the human review layer that used to catch regressions is now thinner relative to the volume of change moving through it.
The 2025 AI Agent Index looked at 30 deployed agentic systems and found the guardrails largely missing. Only 8 of the 30 limit what tools an agent can touch. Only 7 include any defense against prompt injection. Only 9 have documented sandboxing or VM isolation. That's most deployed agents running without the basic containment a human engineer would take for granted.
Postmortem discipline matters more here, not less. A postmortem that ends at "the agent hallucinated" hasn't produced a fix, it's produced a shrug, and the same failure class will show up again next quarter because nothing about the system changed. The rigor that works for a human-authored incident, tracing the failure to a specific gap and building a guardrail around it, has to apply just as strictly when the author was an agent. For pipelines running under AI governance, the bar tightens accordingly, and reaching it requires verification wired directly into the deploy pipeline itself, rather than added on afterward as a separate check someone remembers to run.
Using MTTD and MTTR together to find the actual bottleneck in a team's pipeline
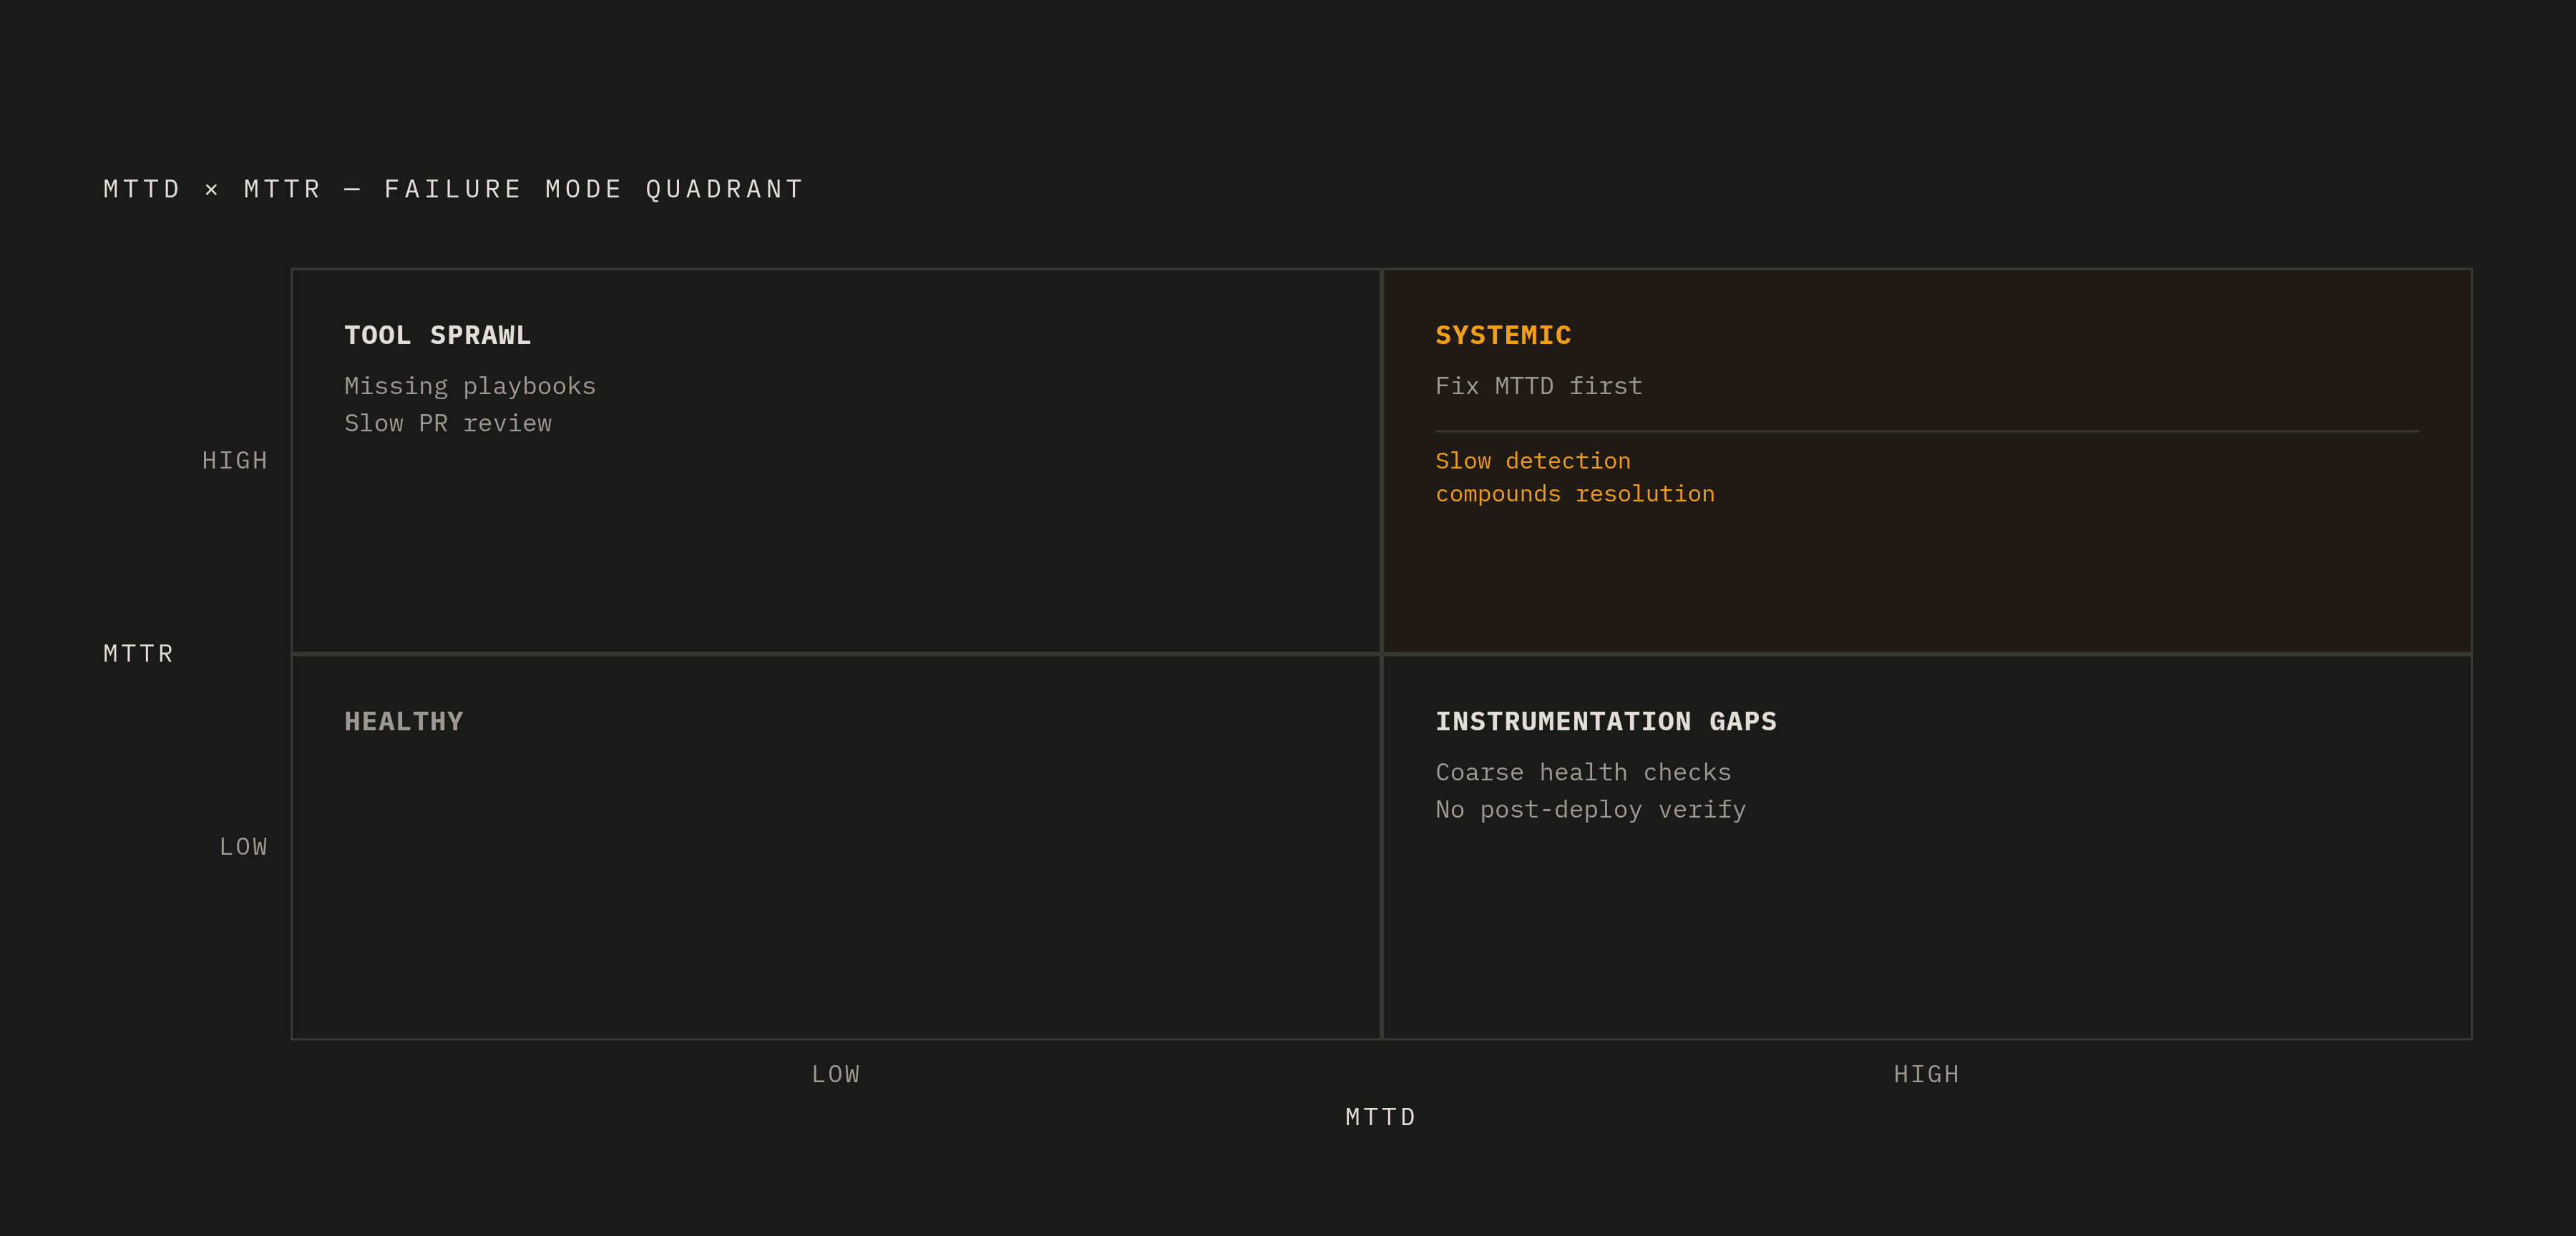
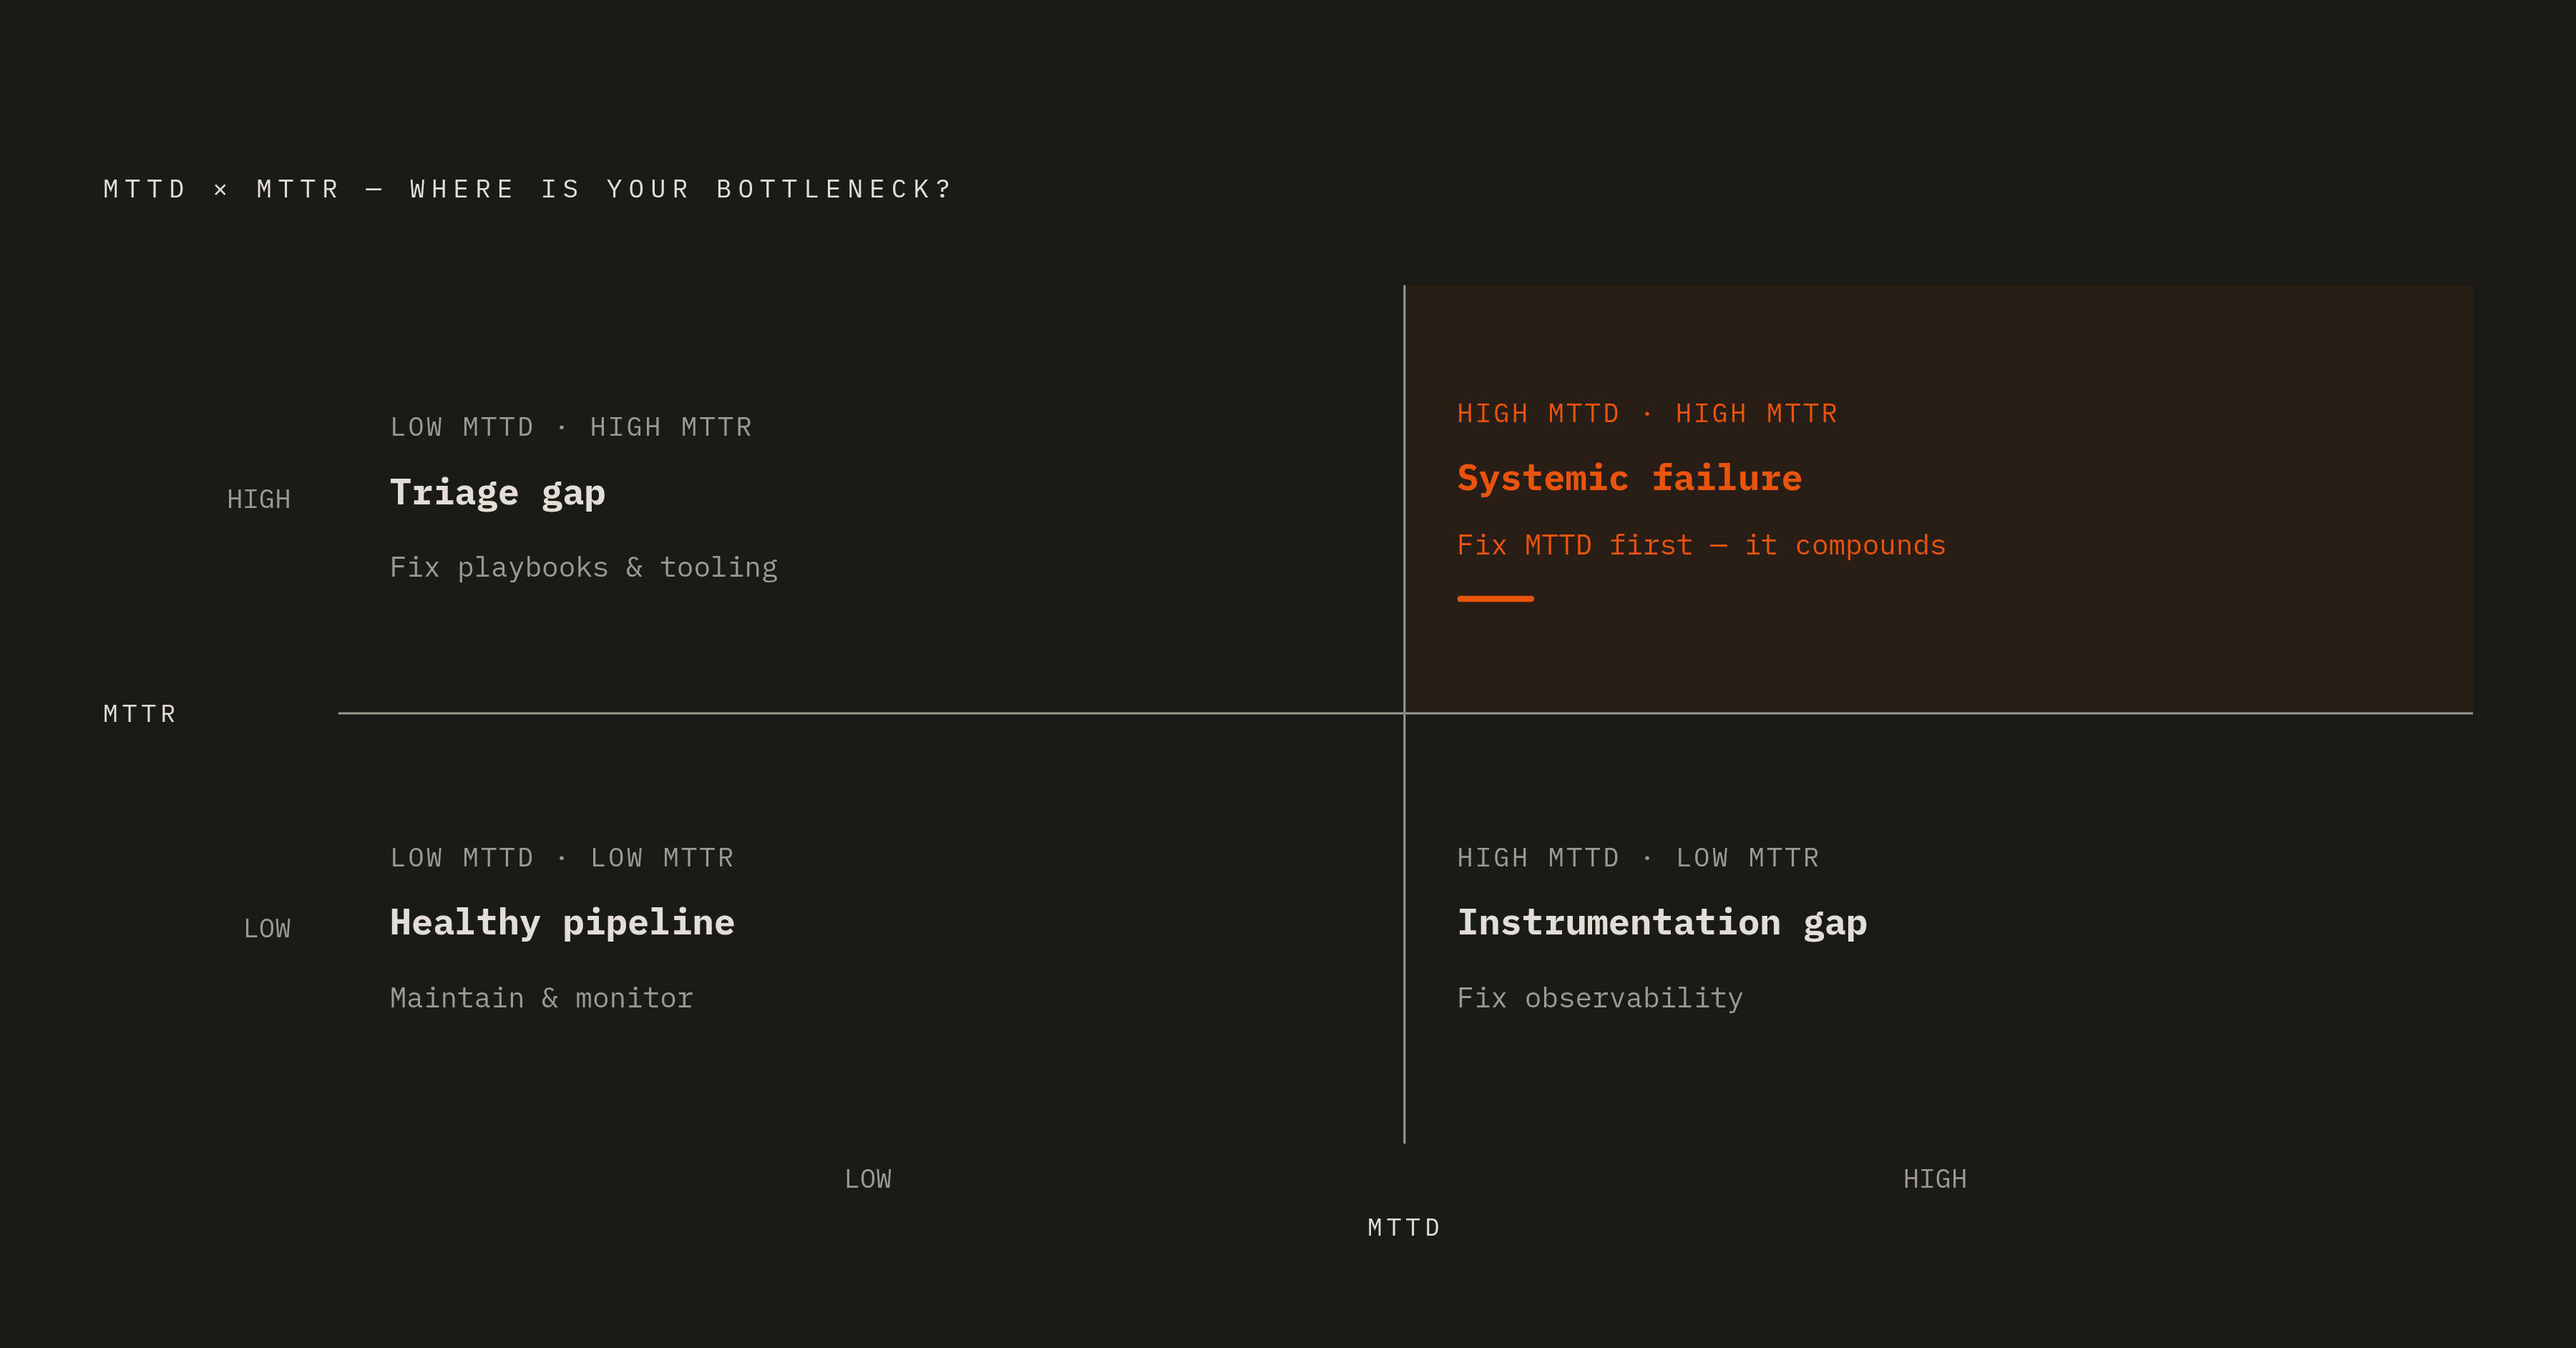
Put the two clocks side by side and they tell a team exactly where its time is going. High MTTD paired with low MTTR means detection is the problem, instrumentation gaps, coarse health checks, no post-deploy verification. The team moves fast once it knows something's wrong; it just finds out too late. Low MTTD paired with high MTTR flips it: the alert fires quickly, but triage, diagnosis, or repair drags, usually because of tool sprawl, missing playbooks, slow PR review, or a verification step nobody bothered to run.
Both high at once means the problem is systemic, and it needs attention on both fronts, though MTTD deserves the first move, since a slow detection clock compounds directly into a slower resolution clock behind it.
Measuring any of this well takes some discipline. MTTD has to be based on when the incident actually started, not when the alert happened to fire, which means going back through telemetry after the fact rather than trusting the alert timestamp at face value. MTTR needs one consistent definition of "resolved," a closed ticket, telemetry back at baseline, a published postmortem, pick one and hold to it, because switching definitions between incidents makes the trend line meaningless. Track both metrics over rolling weekly or monthly windows, since a single incident tells a story but a trend tells whether a process change actually worked.
Once the bottleneck's identified, the fix follows directly. An MTTD bottleneck calls for automatic post-deploy verification, alert triggers rebuilt around user-facing signals instead of infrastructure metrics, and an audit of which services are emitting no telemetry at all. An MTTR bottleneck calls for consolidating incident context into one place, building playbooks ahead of time for the failure types that keep recurring, and treating a fix PR as a first-class part of incident response, worthy of fast-track review, not a ticket sitting in the ordinary queue.
MTTD and MTTR are diagnostic instruments rather than numbers a team reports upward to look good in a quarterly review, and read correctly, they point straight at the specific, fixable part of a pipeline that's actually losing time.