Alert Fatigue Root Causes in Backend Engineering Teams
Most backend teams field thousands of alerts weekly, but only a fraction demand immediate action.
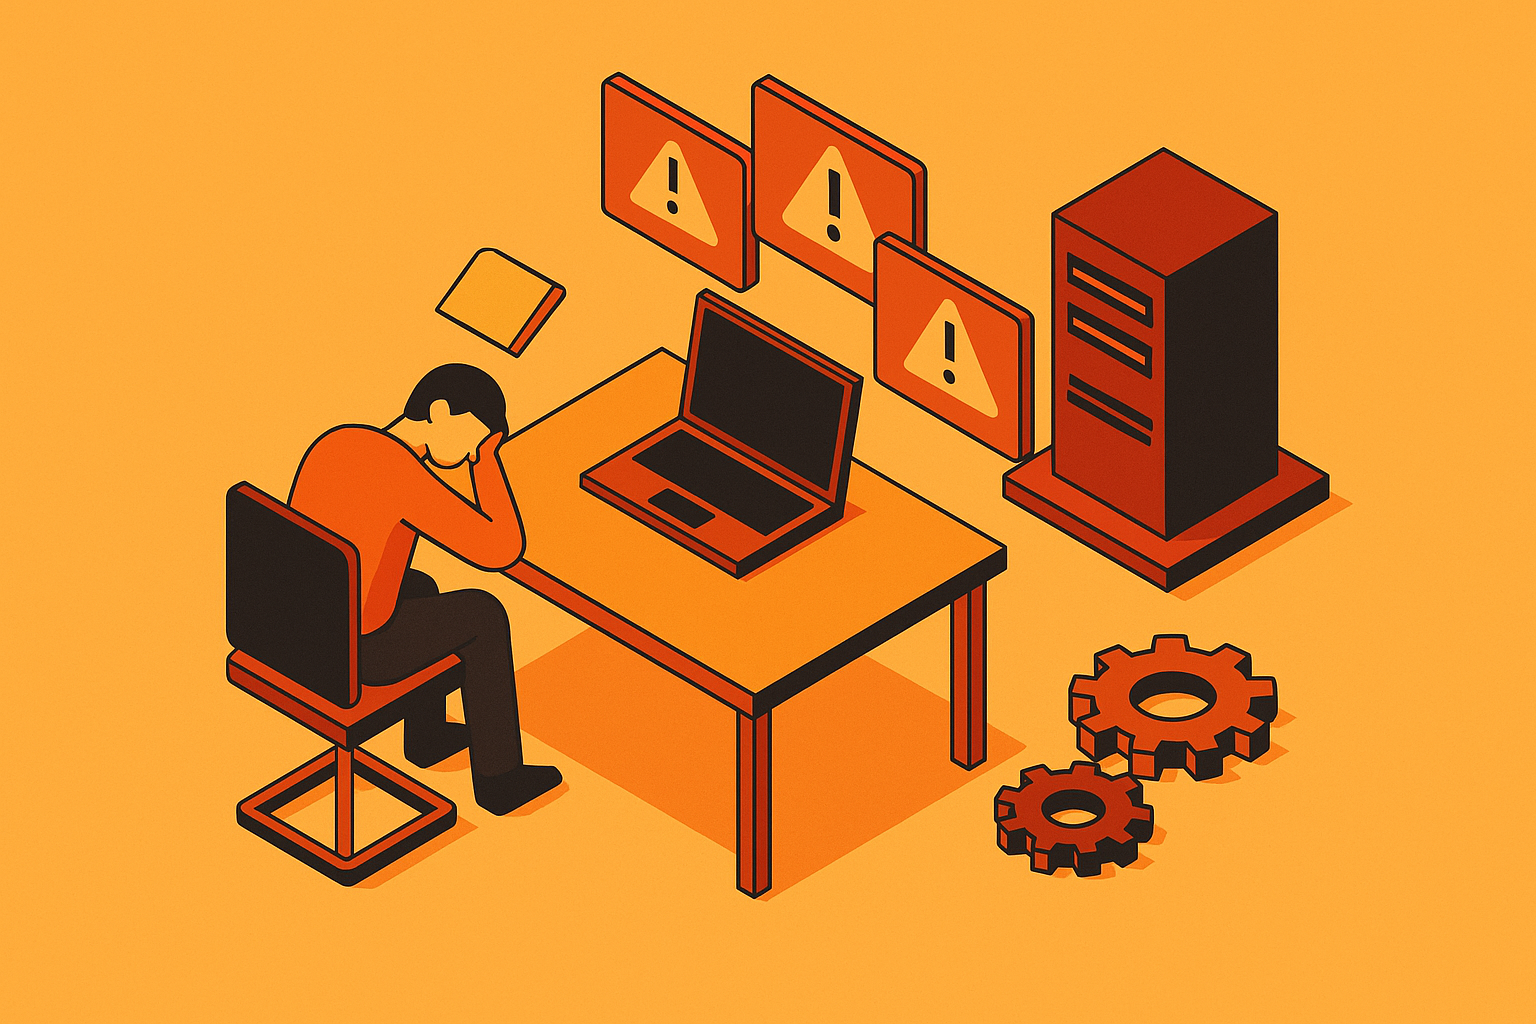
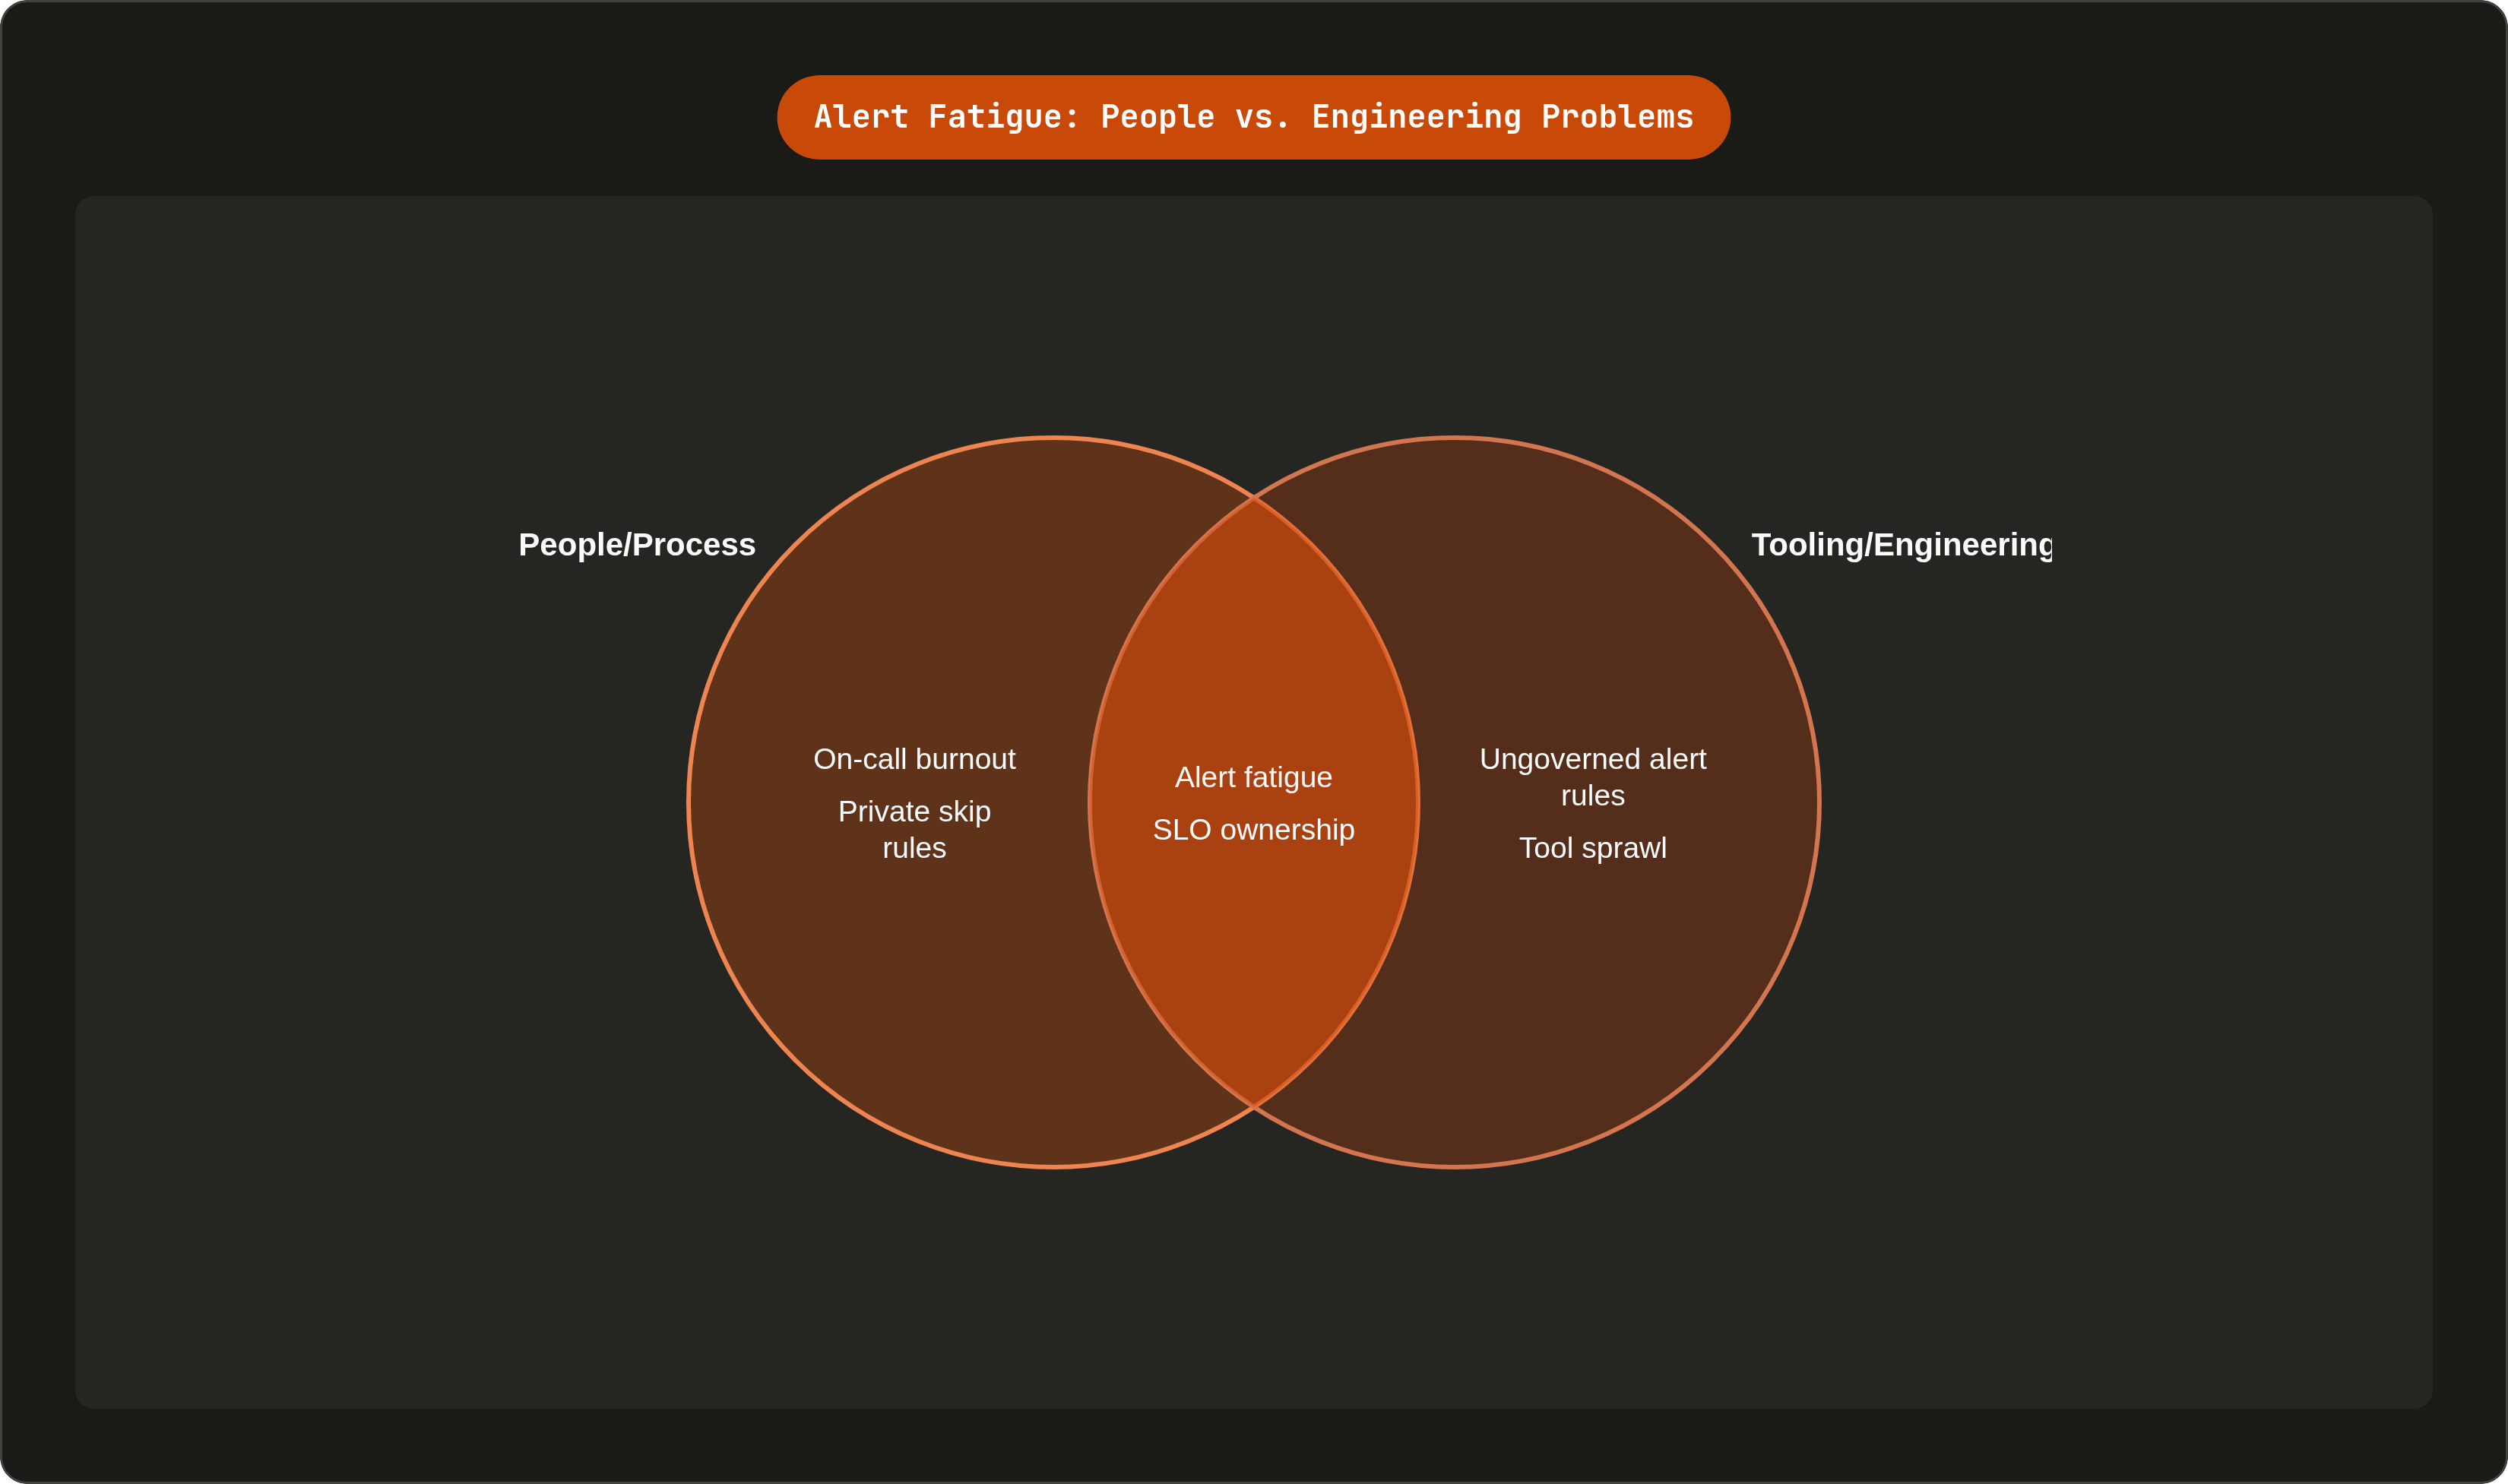
Alert fatigue in backend engineering doesn't come from a discipline gap. It shows up when tooling throws off noise faster than anyone can tune it, and engineers do the only thing the math allows: they ignore most of it. You can train people harder, tighten the escalation policy, rotate on-call more fairly, and none of it touches the real cause. If nine alerts out of ten carry no signal, ignoring them isn't negligence; it's the rational move in a broken system, and treating it like a willpower problem just delays the actual fix.
Where the blame lands matters. Call alert fatigue a people problem and the fix is always more process, while the misconfigured thresholds, the orphaned alert rules, the five monitoring tools that don't talk to each other, sit untouched. Tooling problems get fixed by engineering work. People problems get "fixed" by asking tired humans to try harder, which is just a slower way of not fixing anything.
The volume and noise problem backend teams are actually living with
Most backend teams aren't fielding dozens of alerts a week. They're fielding thousands, and only a sliver need a human to do anything right now. Nobody backed into this through bad luck or one bad config. It's just what an on-call rotation looks like in 2025.
The fallout is predictable. Engineers build private, unwritten rules about which alert categories to skip, because nobody has the hours to weigh a thousand pages a week on individual merit. Once that habit sets in, the alert that actually matters gets lost in the pile, same Slack channel, same font, same red banner as everything else. Outages traced back to a dismissed alert aren't hypothetical. They're the line in every postmortem that everyone recognizes and nobody fixes.
There's a human cost sitting underneath the technical one. The Catchpoint SRE Report 2025 names on-call stress as a top driver of burnout and attrition on SRE teams. It shows up as transfer requests, as engineers flatly refusing a rotation, as people quitting the team or the company. A system where almost nothing is actionable is a noise machine with a dashboard bolted on top of it.
Threshold-based alerting set without production context
Ask an engineer how the CPU-at-80% alert got there, and the honest answer is usually: nobody remembers. Someone set CPU at 80, disk at 90, memory at whatever felt safe, probably lifted from a template or copied off the last project's config. These numbers describe infrastructure state. They say nothing about whether a user noticed anything at all.
That's the whole problem, really. A service can blow past its CPU threshold ten times an hour, self-resolve every time, and still land comfortably inside its SLO for the day. Every one of those pages was noise, technically correct and completely useless. The Google SRE Workbook gives the textbook case: a service sitting right at its SLO boundary, wired to a basic time-windowed threshold, can fire more than a hundred times a day. Every page gets waved off, the service still hits its SLO, and not one of those alerts informed a decision.
Google's own fix, laid out in that same SRE literature, is to alert on error-budget burn rate and SLO threat instead of a line someone drew six months ago and forgot about. Most teams still haven't made the switch. Setting an SLO means getting a team, sometimes a whole org, to agree on what "good" means for a given service, and that's a negotiation as much as engineering, so it keeps getting punted. Threshold alerting needs zero service-specific context. You wire it up in five minutes without talking to anyone. And once one team's threshold config gets copy-pasted into the next service's setup, the same miscalibration spreads template by template across the fleet. No amount of on-call discipline fixes an alerting model that was never wired to the thing it's supposed to protect.
How alert rules accumulate without anyone governing them
Alert rules get created constantly. They almost never get deleted. That one asymmetry explains a surprising share of the noise problem on its own: a rule set that only grows is a rule set that eventually drowns everyone under it.
The growth follows a few well-worn paths. A new service launches with an alert config copied wholesale from an old one, whether or not the traffic pattern or failure modes have anything in common with it. A postmortem spits out three new alert rules as action items, and those rules fire forever, because nobody revisits an action item once the retro closes. Teams reorg, ownership shifts twice, and eventually nobody can say which rules still apply to which service. Severity labels drift the same way. Given enough time, almost everything gets tagged P1, because nobody wants to be the one who downgraded the alert that turned out to matter.
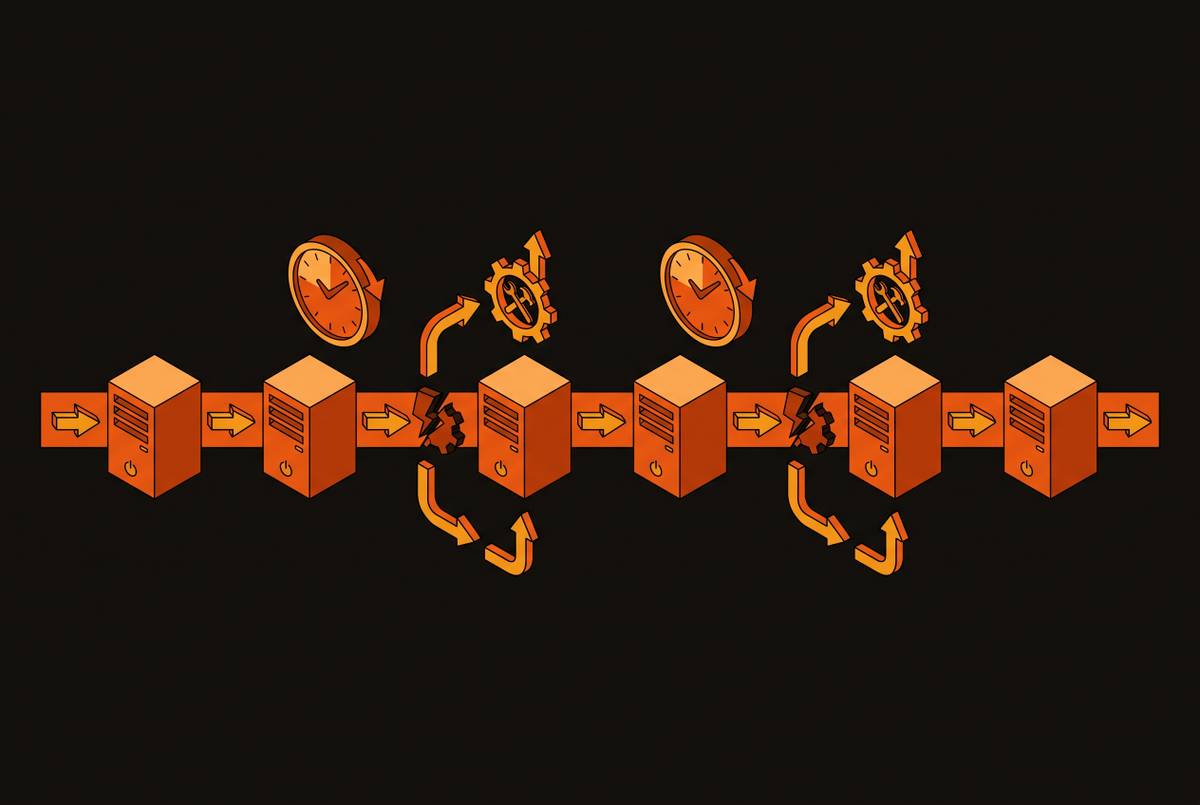
Flapping alerts deserve a callout of their own, because they do a specific kind of damage. An alert that fires, resolves, fires, resolves, over and over, with no action ever required, trains an engineer to stop reading that entire category. Hysteresis and time-based suppression fix most of this, but both need upkeep, and an ungoverned rule set is, by definition, not getting upkeep.
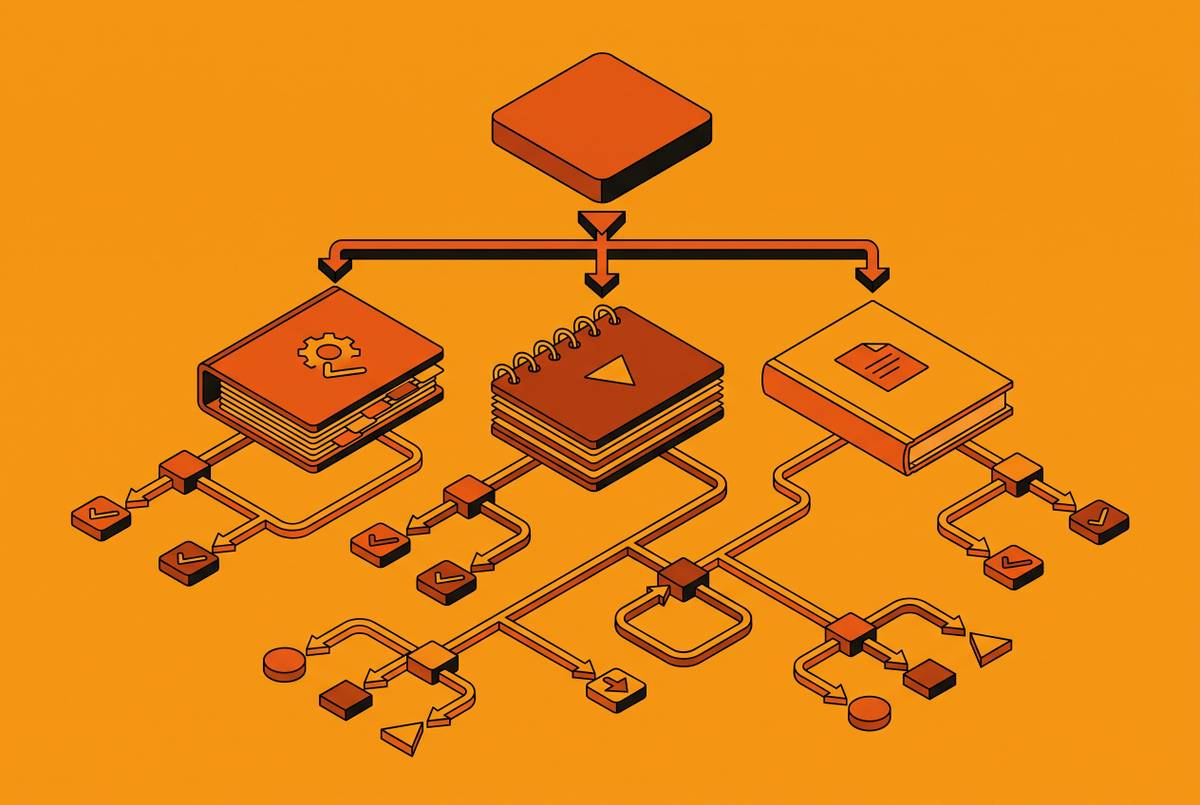
A governance process that actually works looks unglamorous: regular audits against an actionability rate, a named owner for every rule, a process for retiring anything that hasn't triggered a real fix in months. One number worth checking honestly: if fewer than a third of your pages lead to real remediation, the rule set itself is the incident.
Multiple tools generating overlapping signals with no shared context
The standard backend stack runs one tool for infrastructure metrics, another for APM, another for logs, another for uptime checks, another for cloud provider alerts. Each watches its own slice and fires on its own logic, with zero awareness that four other tools are staring at the same failing system from a different angle.
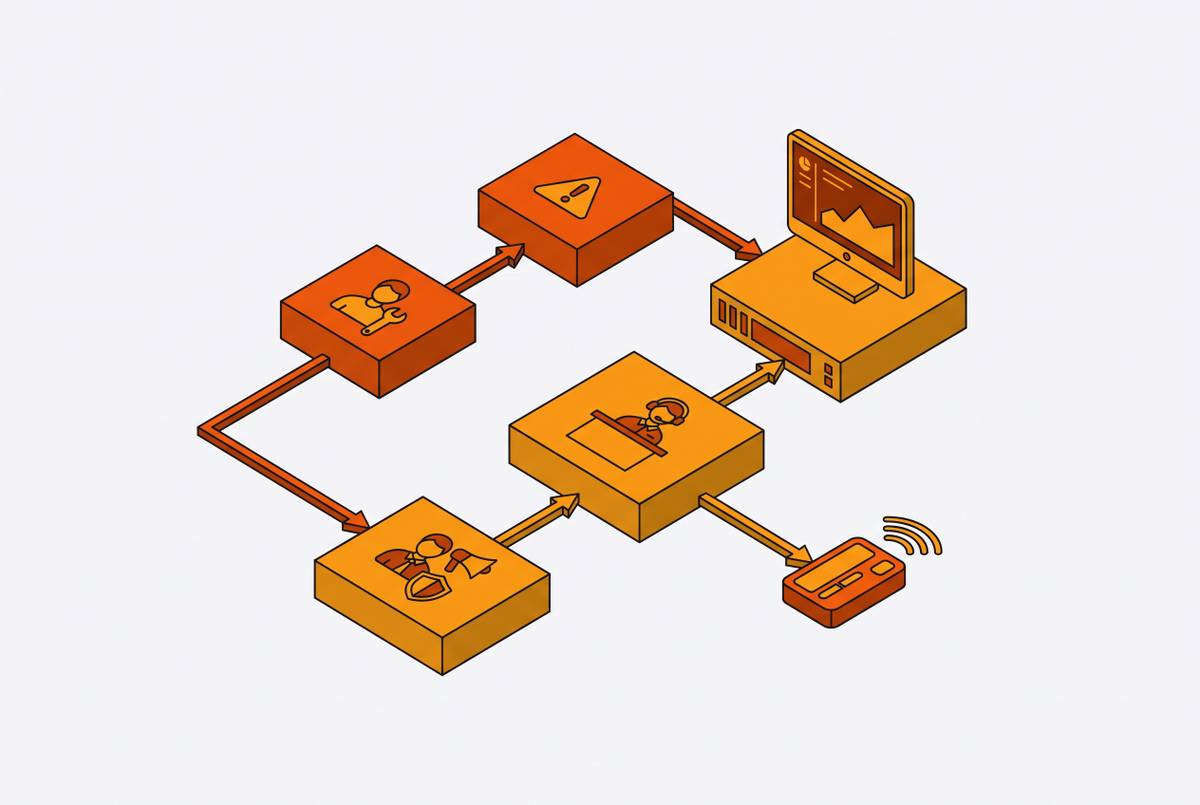
So one incident, one root cause, sets off a wave from every tool at once, usually with no deduplication and no shared incident ID tying any of it together. In practice this is brutal. The on-call engineer has thirty alerts across four channels before they've opened a terminal. The first ten to thirty minutes go to figuring out which alerts are related, who owns the service, and which of the five open tabs actually has the context that matters. Every extra tab opened mid-incident is SLO burning down in real time.
Cost pressure makes it worse. As observability data volumes climb, teams get pushed to sample aggressively or drop signals at ingestion just to keep the bill sane, and that creates gaps that make cross-tool correlation harder exactly when it's needed most. The tax isn't only paid during the incident, either. It's the daily context-switching, the alert storms that bury the one signal that actually explains what happened, and an on-call engineer who has quietly become the human integration layer holding five disconnected tools together in his own head.
Instrumentation gaps and blind spots that make alerts unreliable
Most conversations about noisy alerts focus on the rules. Almost nobody asks whether the signal feeding those rules is even complete. That's the miss, because a lot of alert unreliability starts upstream of the rule entirely.
Take distributed tracing. Most automated root-cause tools assume full trace coverage across the call path. Real microservice deployments rarely look like that. There are uninstrumented services scattered through the graph, and each one is a blind spot, generating false-positive or flatly uninformative alerts because the system is working off partial data and can't localize where the failure actually happened.
Context propagation failure is the quieter version of the same bug. Trace context breaks silently across async boundaries, message queues, reactive streams, anywhere a request stops being one linear thing and turns into distributed work. An engineer staring at a broken or missing trace can land on exactly the wrong conclusion in either direction: assuming health when there's a real problem, or assuming a fire when the telemetry is just incomplete.
The three observability pillars get run in silos more often than not. Metrics say something's wrong. Traces show where in the graph it happened. Logs explain why. Keep those three in three separate tools with no link between them, and an alert fires off a metric while the trace and log needed to actually act on it sit somewhere else entirely, disconnected from the page that just woke someone up at 3 a.m.
OpenTelemetry addresses a good chunk of this structurally. OTel reached CNCF graduation in 2026, and adoption has climbed since, letting teams collect metrics, traces, and logs once and route them to whatever backend they choose, instead of running a different agent per tool and hoping the data lines up afterward. Sampling is its own tradeoff. A high-traffic service can't trace every single request without blowing the observability budget, so tail-based sampling, full fidelity on errors and slow requests, thin sampling on everything else, keeps the signals that actually matter. Build an alerting system on top of gapped telemetry, though, and the alerts come out structurally unreliable no matter how carefully someone wrote the rules.
Deployments that ship without production verification create their own alert storms
Most CI/CD pipelines treat a green test suite as proof the code is ready. It merges, it deploys, everyone moves to the next ticket. Production doesn't behave like staging. Real traffic patterns, real data distributions, real integration quirks that no staging environment fully replicates, no matter how much effort goes into faking it.
When a regression slips through that gap, it doesn't surface as a caught bug in review. It surfaces as a production alert, reactive by nature, arriving after users have already felt it, with nothing tying it back to the deploy that caused it.
Canary deployments exist to close exactly this gap. A new version gets a small slice of real traffic before the full rollout; key metrics get watched against pre-deploy baselines, and exposure only widens if the telemetry stays clean at each step. But canaries have a failure mode worth naming plainly: if the telemetry underneath is incomplete or lagged, the whole setup produces false confidence instead of an early warning. A canary is only as good as the instrumentation feeding it.
Gartner calls the practice of pushing this even earlier "observability-driven development," instrumenting code so production state is visible from the moment of deploy rather than after the first page fires. The tie to alert fatigue is direct. Teams that skip post-deploy verification generate alerts reactively and in bulk, because every undetected regression that reaches full traffic doesn't produce one clean signal. It produces a storm of correlated alerts that a deployment gate would have caught as a single event. One Patch, an AI agent that checks each pull request against live production telemetry after it deploys and opens a fix PR when it catches a regression, is built around closing that gap. OnePatch sits at exactly that seam, between the pull request and live production, checking each deploy against real telemetry automatically and opening a fix PR the moment it catches a regression. Verification becomes a pipeline step instead of a cleanup job for monitoring to handle later.
Where AI-assisted incident response helps and where it currently falls short
The appeal is obvious. An agentic system can read telemetry, correlate signals across five tools, and land on a working hypothesis faster than an exhausted on-call engineer piecing context together by hand at three in the morning. Current systems are genuinely strong at a narrow set of things: tying alerts from different sources to one shared incident, matching live telemetry against historical incident patterns, suggesting runbook-aligned remediations without someone maintaining a separate rule library by hand.
Independent benchmarks keep this honest. IBM's ITBench evaluation, run against real SRE scenarios, found current AI models resolve a meaningful slice of incidents autonomously, and a limited slice at that. It says the technology genuinely works on part of the problem and still has real distance to cover on the rest. Nobody should read that number as either a breakthrough or a dead end.
There's evidence this works at production scale, too. The LogPilot deployment, published September 2025 and run across a large cloud production environment, found LLM-based alert diagnosis hit an acceptance rate on its root-cause reports north of four in five. That's a real signal that AI diagnosis at scale works now, not a capability still waiting on some research breakthrough down the line.
The workflow taking shape looks less like the static SOAR playbooks from a decade ago and more like an actual loop: diagnose automatically, hand the on-call engineer the key context, propose a fix, execute once someone approves it, then update the playbook based on how the incident actually resolved. Guardrails around that loop aren't optional. Late in 2025, an AI coding agent tied to the AWS Cost Explorer outage deleted and recreated a production environment because of misconfigured permissions, a direct result of missing blast-radius limits and missing peer review. Agent identity, policy-as-code, rollback infrastructure, and audit logging all need to exist before any autonomous action gets near production.
DORA's 2025 findings raise the stakes further. Higher AI adoption in software delivery tracks with higher throughput and higher delivery instability, at the same time, in the same data. Agentic development without automated production verification just means more deploys shipping faster, and more regressions for someone, or something, to catch before they turn into the next wave of pages.
Reframing alert fatigue as an engineering problem with engineering solutions
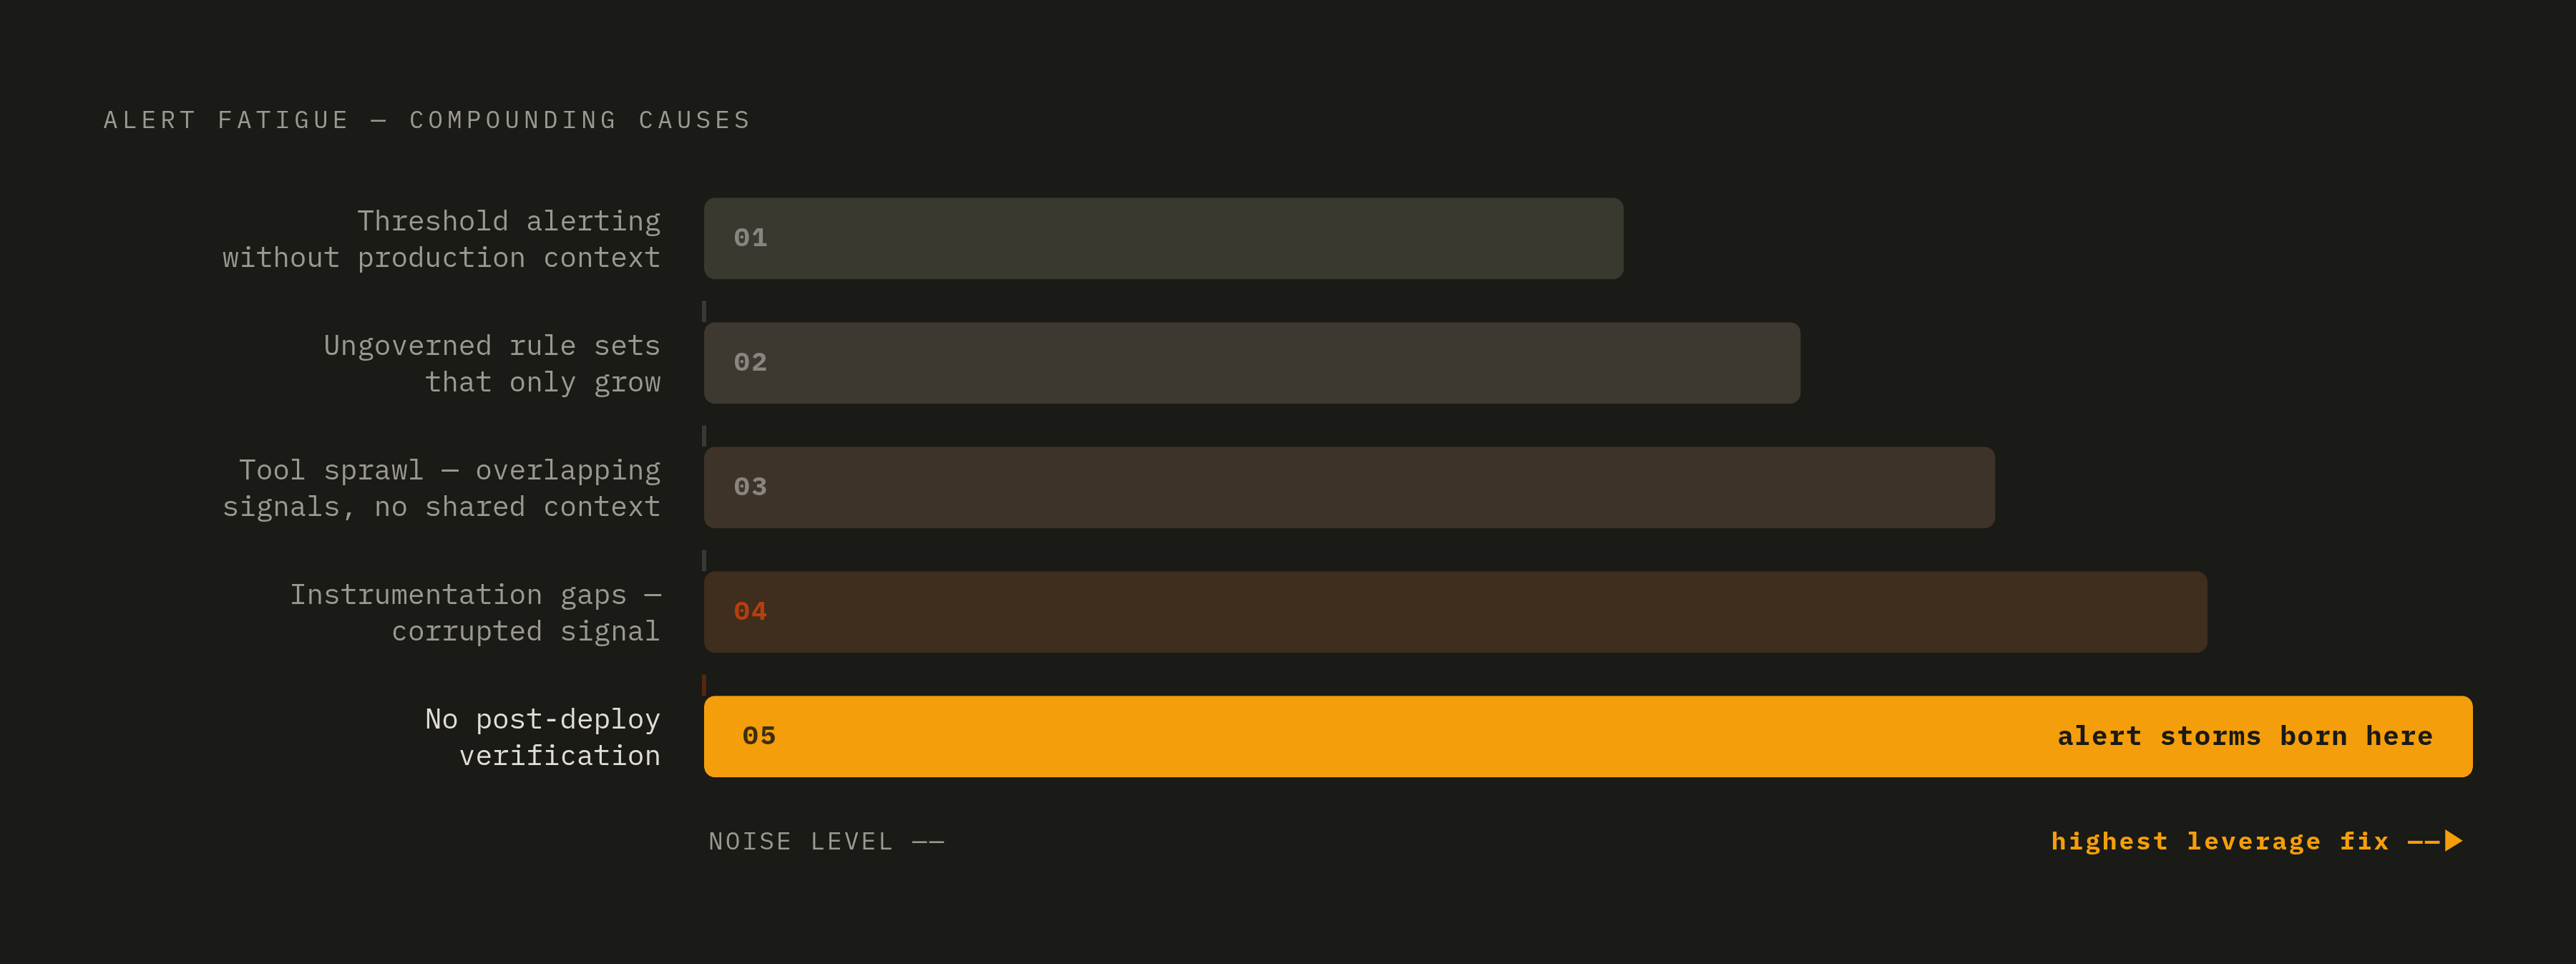
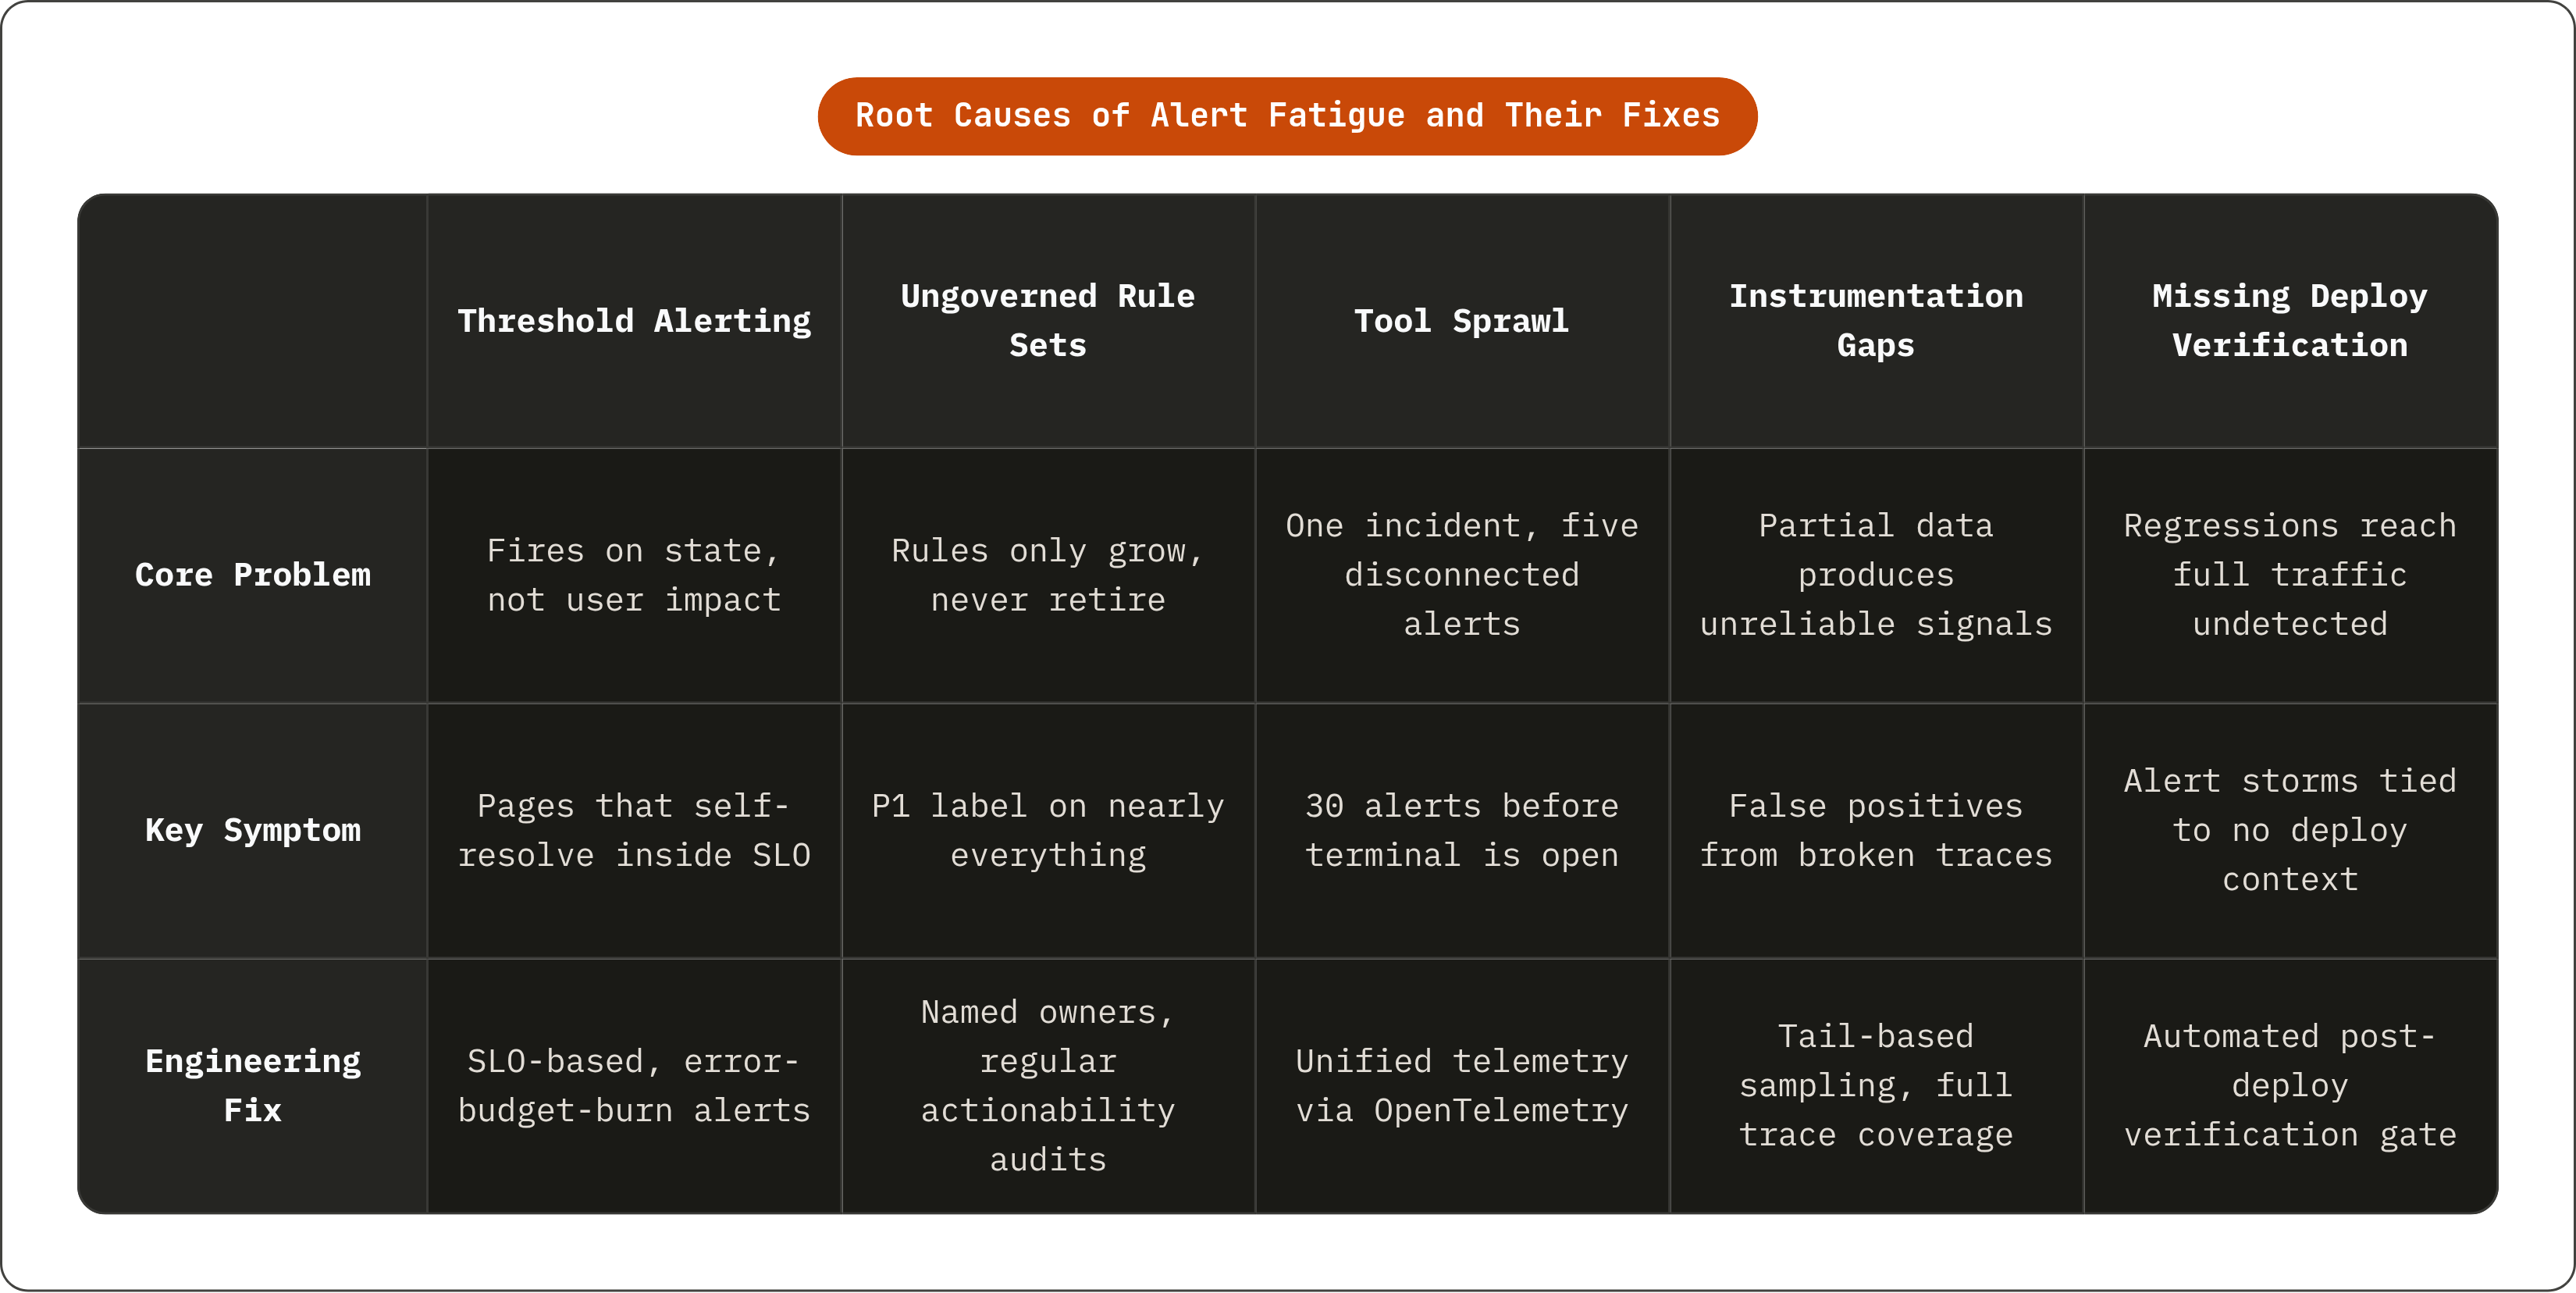
None of these causes sit in isolation. They stack. Threshold alerts fire on conditions nobody needs to act on. Ungoverned rule sets let those alerts pile up instead of getting pruned. Tool sprawl means the alert that does matter arrives stripped of the context needed to act on it. Instrumentation gaps make the underlying signal unreliable in the first place. And without post-deploy verification, regressions reach full production traffic before a single alert carries any deploy context explaining why it fired.
None of the fixes require a research breakthrough. Swap threshold alerting for SLO-based, error-budget-burn alerting. Run an alert governance cadence with actionability as the number that actually gets audited, not just logged somewhere and forgotten. Unify telemetry through OpenTelemetry so metrics, traces, and logs stop living in three disconnected tools. Instrument for observability starting at deploy time, not after impact has already landed. Add automated post-deploy verification as a real gate in the pipeline.
What this buys a team is a shift from reacting to alerts toward catching regressions before they ever become one. Fewer alerts fire because fewer problems survive long enough to need one, not because engineers got better at ignoring them. A team that catches regressions at deploy time, folds twenty correlated signals into one incident, and routes only the pages that need a human has fixed its tooling. That's what on-call discipline looks like once it's actually working, built on engineering fixes rather than requests for people to pay closer attention.
There's no single tool swap that clears all five causes at once, and anyone who tells you otherwise is selling something. Look at your own pager data, find whichever root cause is generating the most noise this month, and fix that one first.