SLO Burn Rate Alerts Compared to Threshold Alerts
Burn rate alerts page you only when service reliability actually erodes, not when metrics twitch.
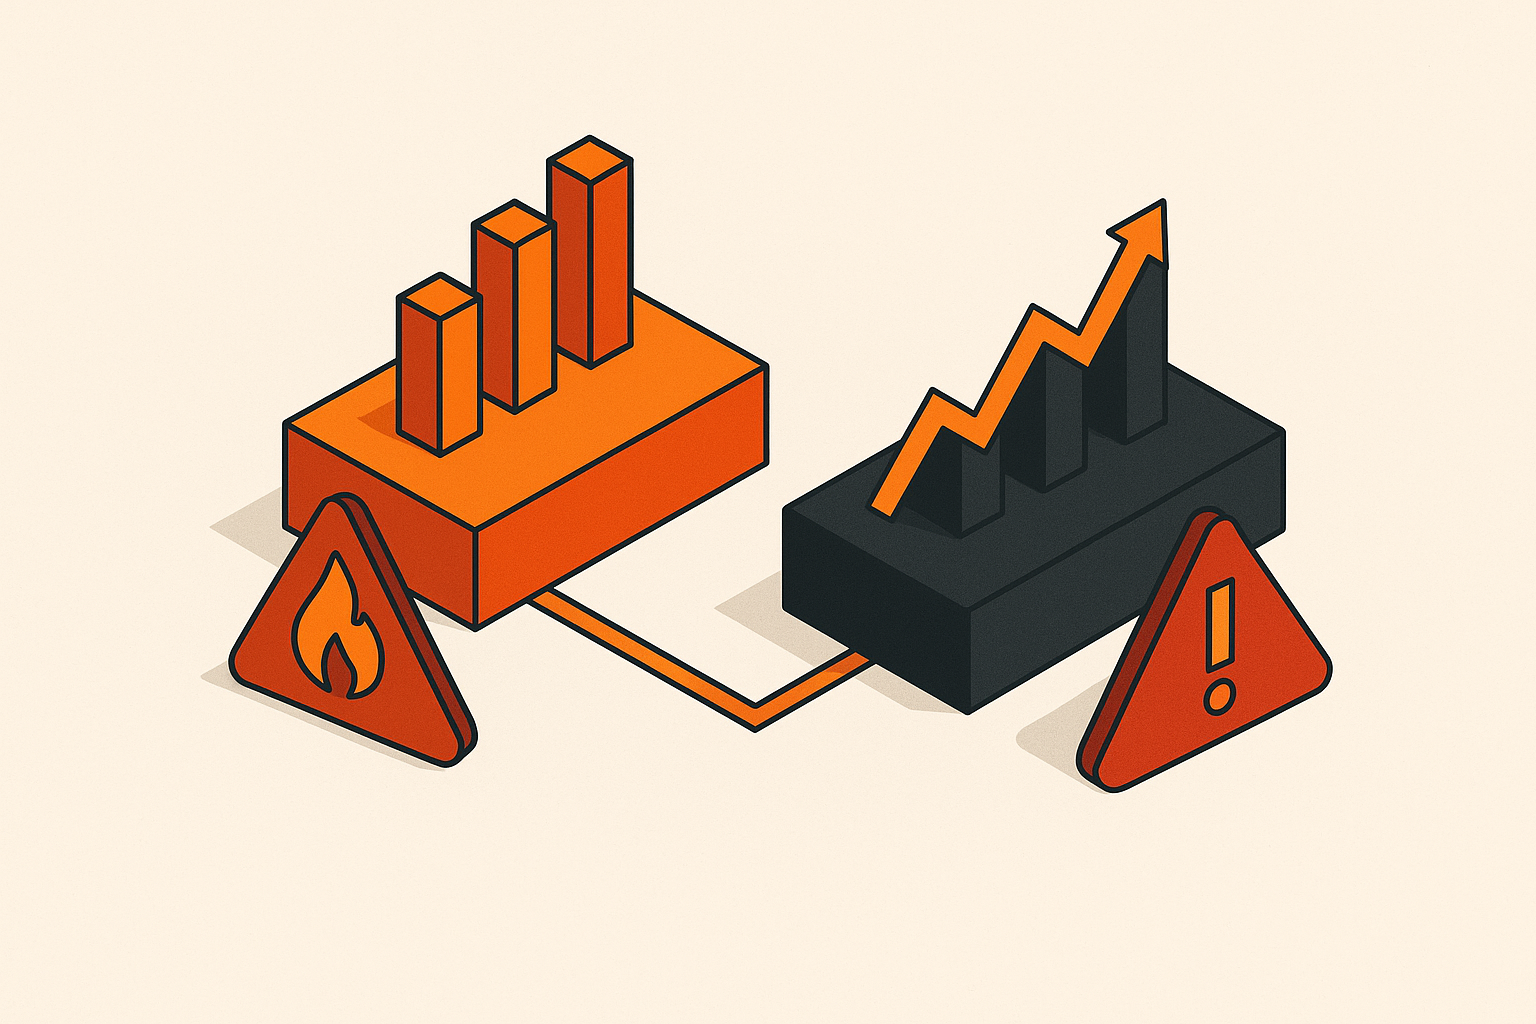
Threshold alerts answer a question nobody on call actually needs answered: has a metric crossed a line someone picked months ago. SLO burn rate alerts answer the one that matters: how fast are you burning through the reliability you promised users. That distinction determines whether an engineer gets paged for a warm server that nobody notices or a genuine degradation that's quietly eating away at the goodwill a service has left.
SLO burn rate alerting fixes the structural problem. Where threshold alerts watch a metric in isolation, burn rate measures how fast a service is consuming its error budget relative to the SLO's target window, so the signal is tied directly to what users were promised rather than to a line someone picked months ago. A burn rate above 1 means the budget is depleting faster than the window allows; a rate of 10 against a 30-day window means the budget is gone in three days if nothing changes. That calculation carries memory across the window and is proportional to actual user impact, which is why it catches cumulative degradation, including intermittent spike patterns that never look sustained, while high CPU or low per-component latency that nobody notices stays silent.
The assumption baked into threshold alerting is simple and, in a lot of production systems, wrong: a warm server means a bad user experience, and a calm one means a good one. High CPU utilization is often exactly what you want; it means you're using the capacity you paid for. Low per-component latency tells you nothing about whether the end-to-end request the user actually cares about came back fast, or came back at all. Tuning the threshold value doesn't fix this. You can move the line up, move it down, add a second line for warning versus critical, and none of it changes the fact that the metric and the user's experience are two different things being asked to stand in for each other. The problem is structural, baked into what threshold alerting was designed to watch in the first place.
What threshold alerts actually miss: false positives, false negatives, and the slow creep they never catch
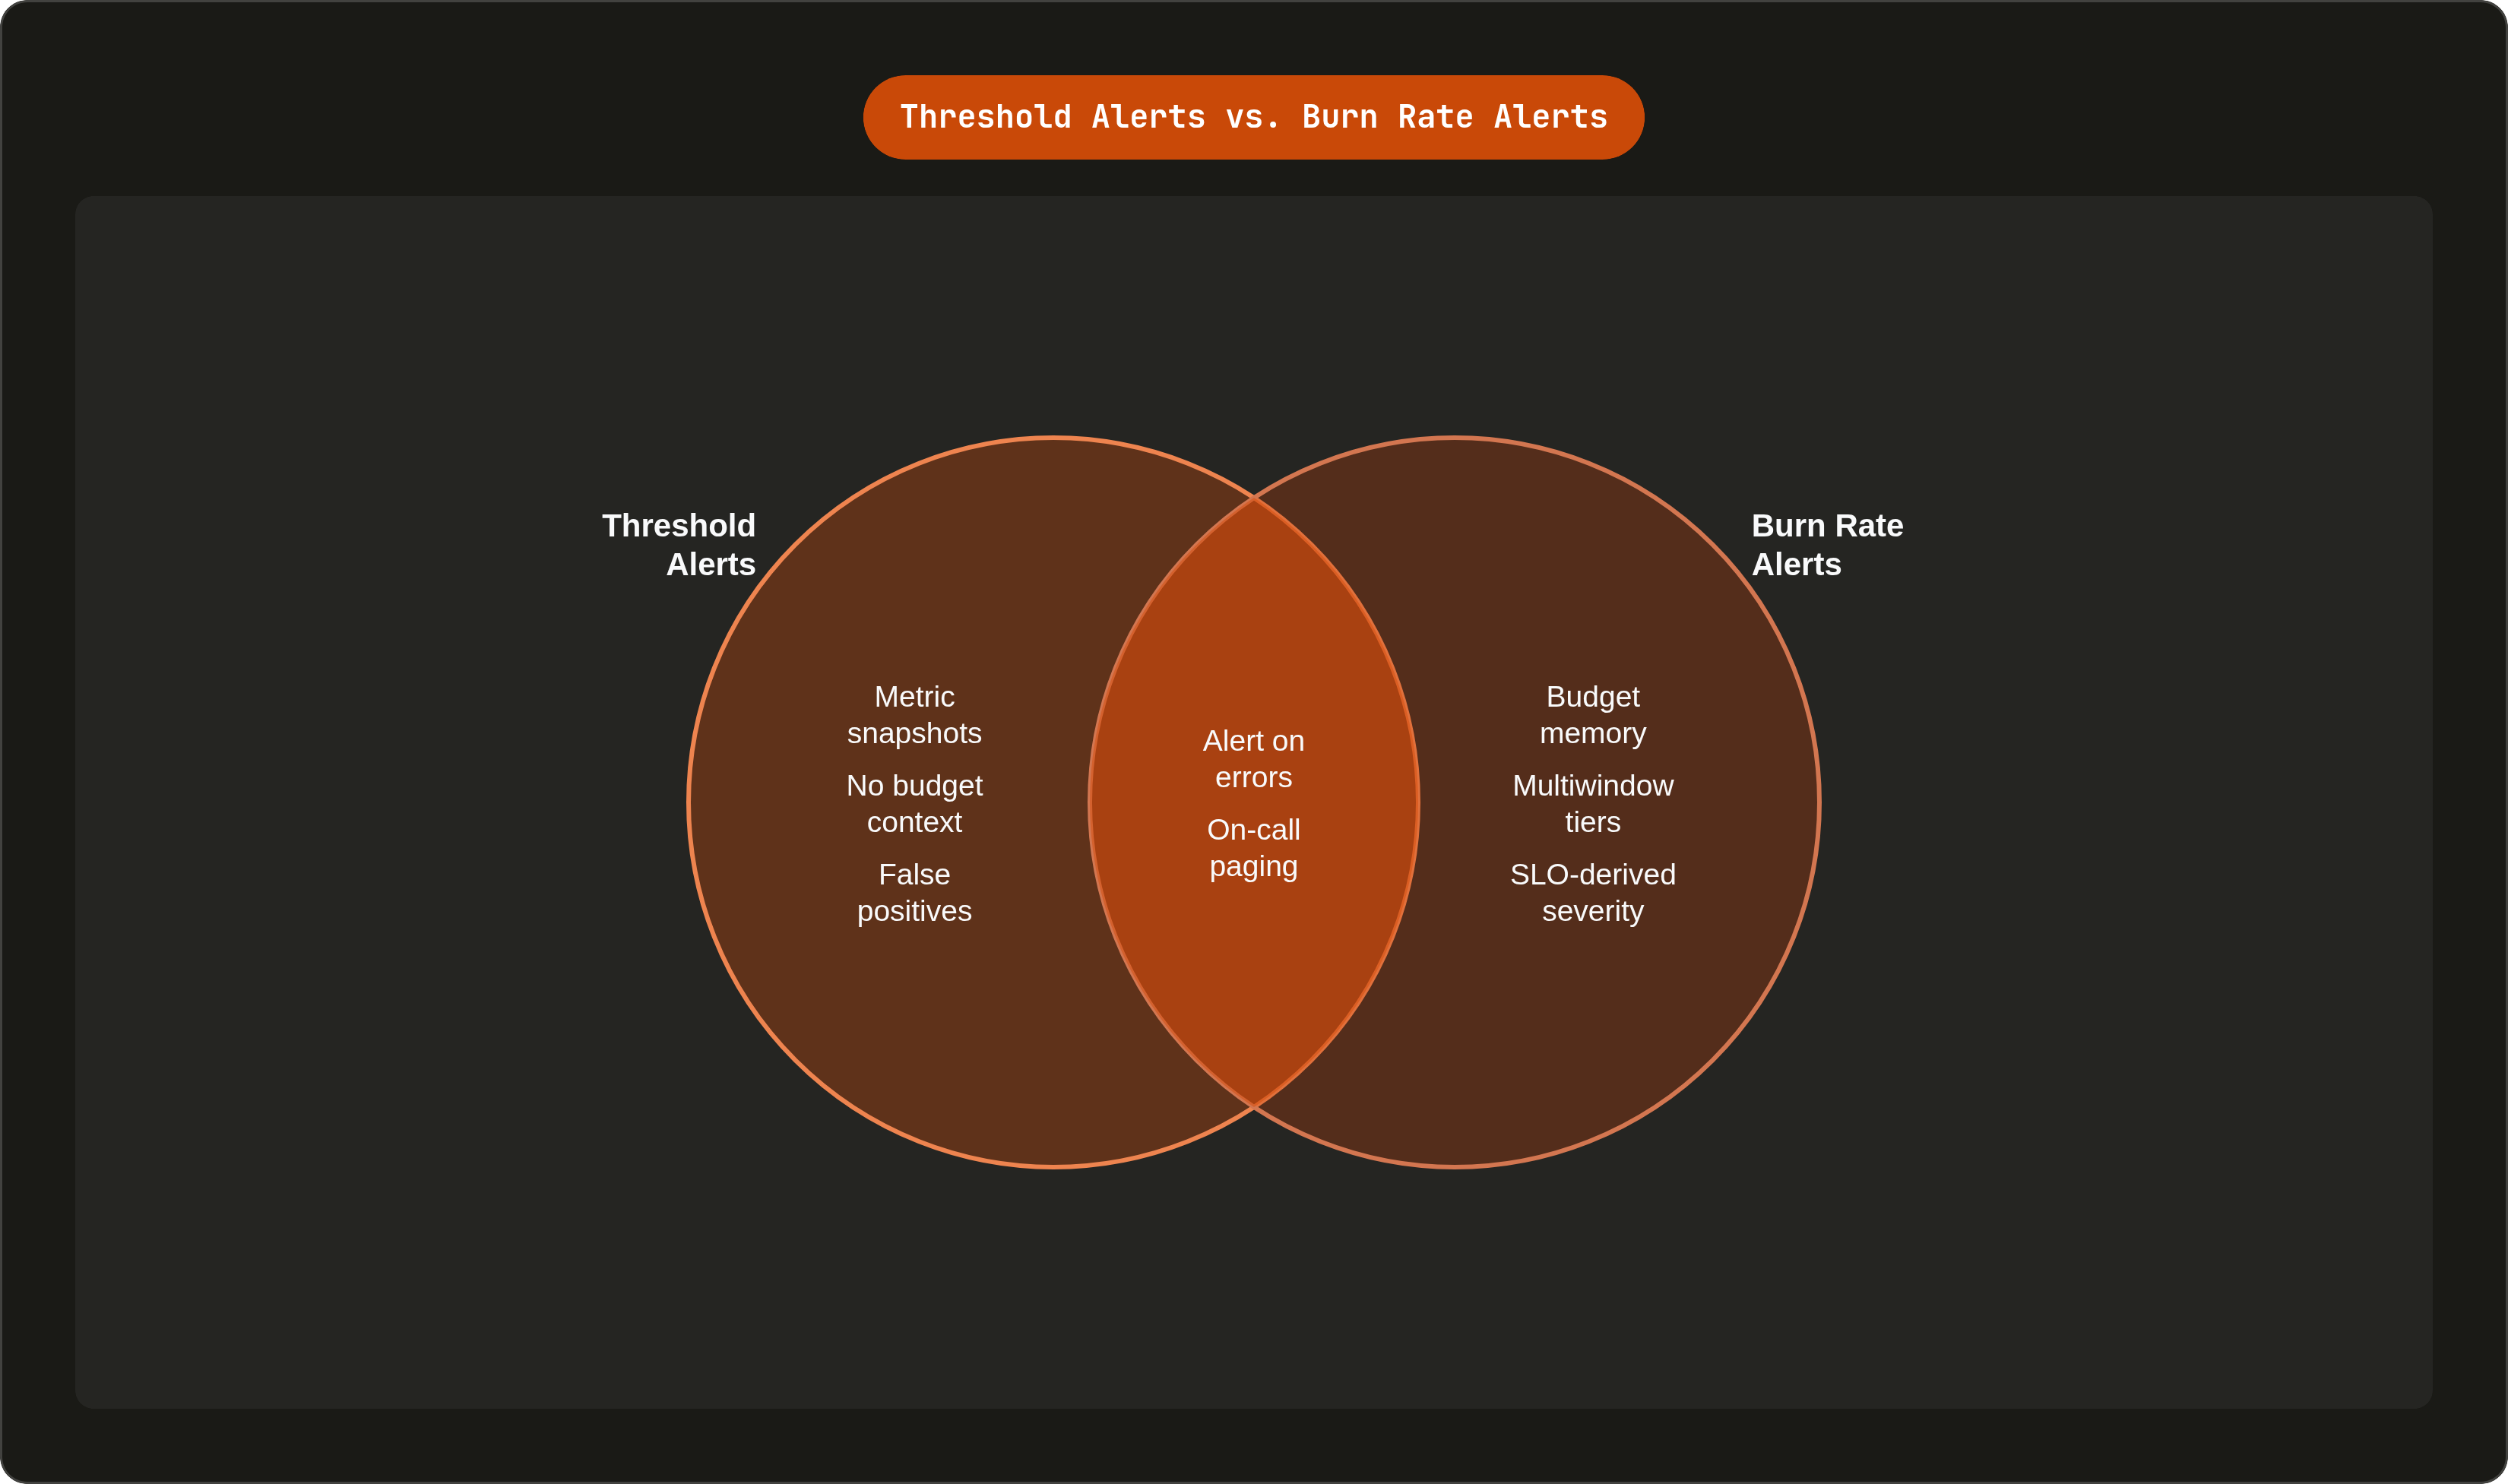
Threshold alerting fails in two directions, and both cost something. False positives happen when a brief traffic spike crosses the line, the page fires, and an engineer wakes up at 3 AM to find nothing actually wrong by the time they open a laptop. False negatives are worse: degradation sits just under the threshold indefinitely, never triggers anything, and users absorb the damage the whole time.
The hardest failure mode to argue against threshold alerts, though, is the slow creep. Google's SRE Workbook lays out a scenario that has become something close to canonical in this discussion: a service experiences complete error spikes lasting five minutes, recurring every ten minutes. Each spike burns roughly 12% of a 30-day error budget. String enough of them together and you've lost 35% of the budget, cumulatively, while a threshold alert watching error rate never fires once, because each individual spike resolves before it can be classified as sustained.
Consider what that actually means. The alert stayed silent, and the dashboard, glanced at during the day, looked intermittent and survivable. The engineer had no idea the budget was hemorrhaging, because nothing in the threshold model has memory. A 5% error rate sounds alarming in isolation, but it might be irrelevant if the budget is flush, or it might be the final straw if the budget's nearly gone. Threshold alerts can't tell the difference, because they don't carry that context forward. The alert, in this scenario, was doing precisely what it was configured to do. What it was configured to do, though, was never the right thing to measure.
How does burn rate alerting fix the structural problem with threshold alerts?
Burn rate, a concept that originates from Google's site reliability engineering practice, is a unitless value describing how fast a service consumes its error budget relative to the SLO's target window. The formula is straightforward: divide the length of the SLO window by the burn rate, and you get the time remaining until the error budget is fully consumed.
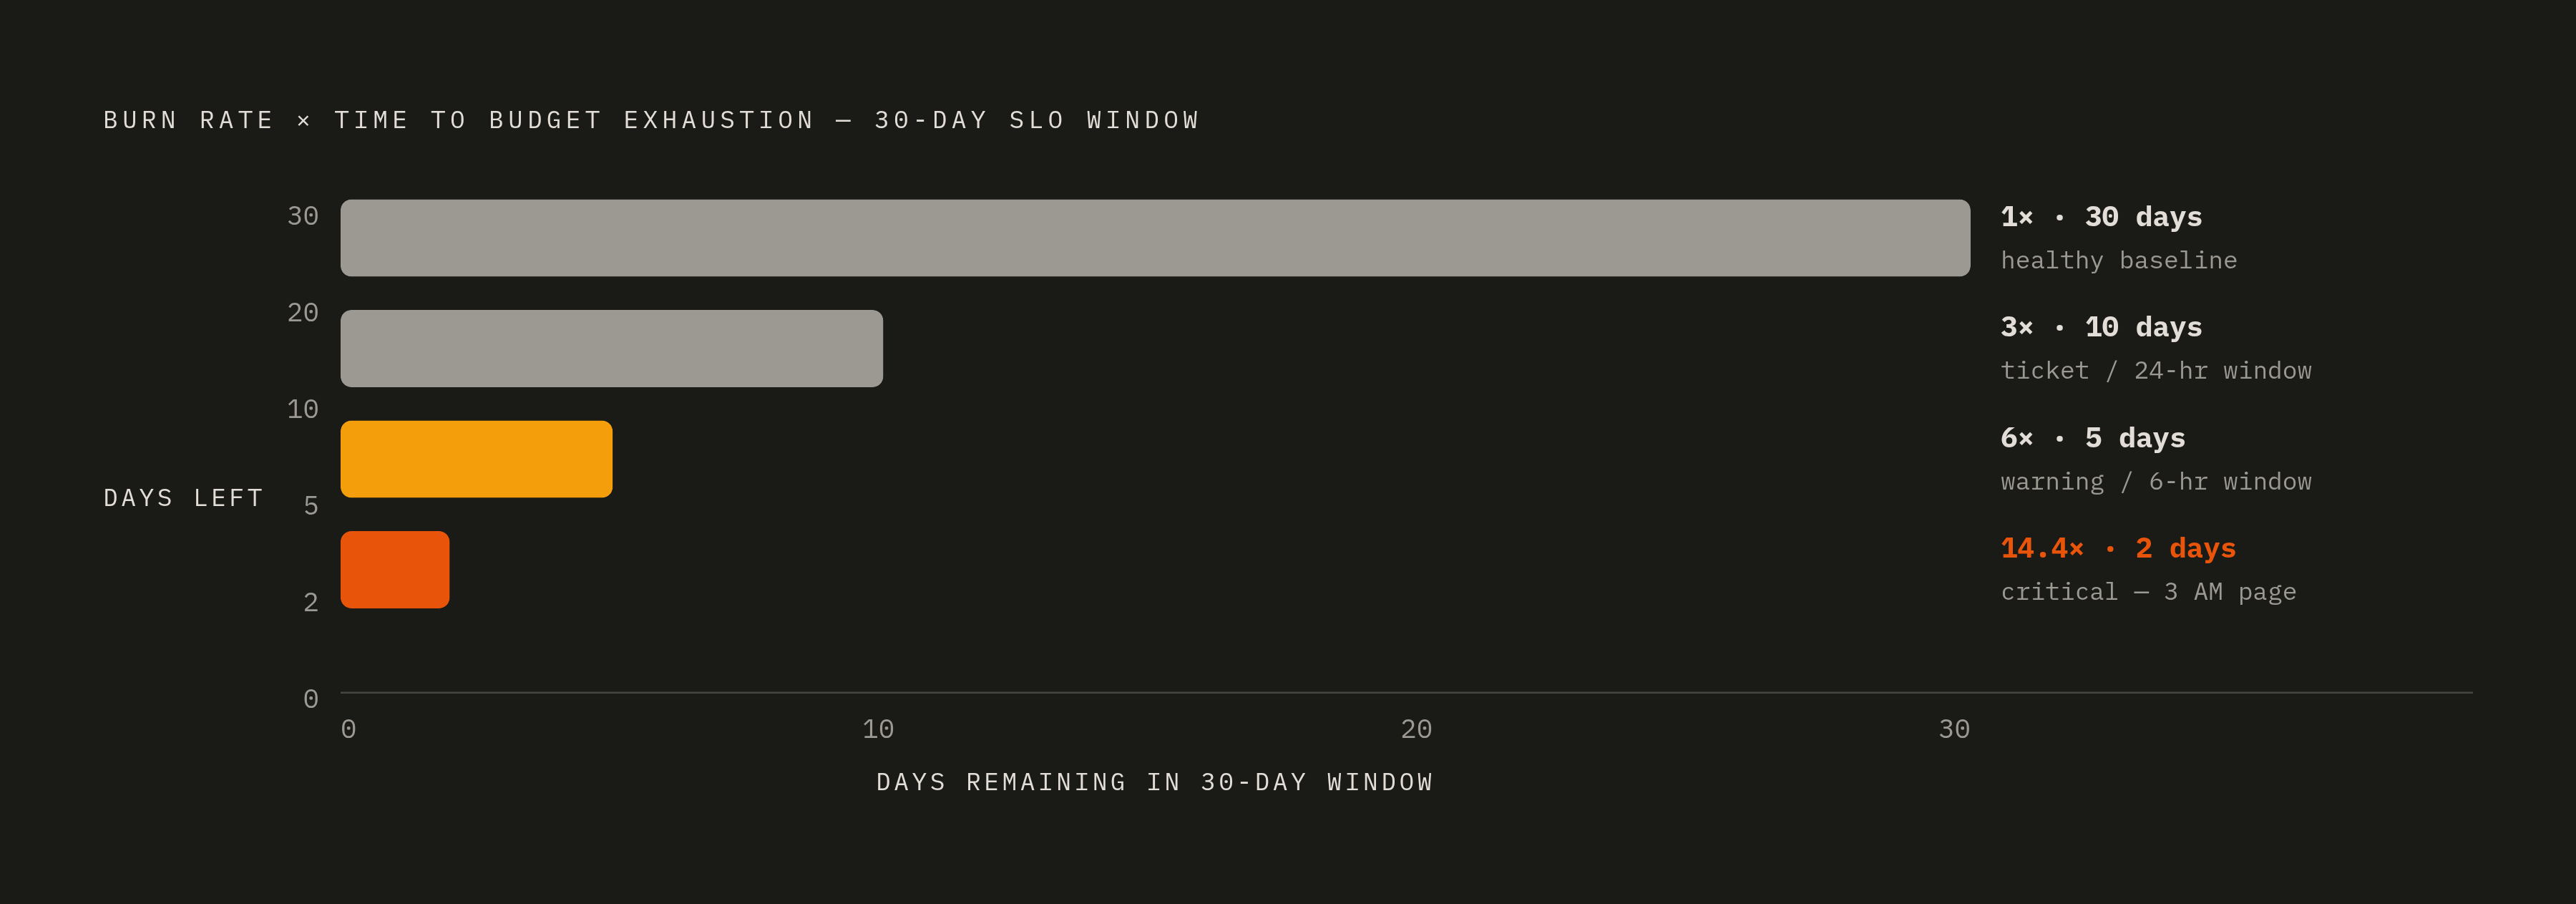
A burn rate of 1 means the service is consuming budget at exactly the sustainable pace, the rate at which it exhausts the full budget right as the window closes. That's fine, by definition. A burn rate above 1 means the service is on track to run out early, and the higher the number climbs, the sooner that happens. A burn rate of 10 against a 30-day window means the budget is gone in three days if nothing changes.
Three properties set this apart structurally from a threshold. It's relative to a promise made to users, derived from the SLO, rather than an arbitrary engineering guess about what a graph should look like. It has memory, accumulating signal across a window instead of checking a single snapshot in isolation. And it's proportional to actual user impact, because the error budget itself descends from the SLO, which descends from what users were told to expect. Go back to the intermittent-spike scenario: a burn rate alert would have caught it, because the cumulative consumption crosses the rate threshold well before any single moment looks catastrophic on its own.
The multiwindow, multi-burn-rate structure that prevents the alert from becoming its own noise source
A single burn rate window, implemented naively, can be fooled by the same kind of brief spike that fools a threshold alert. At that point you've just built threshold alerting with extra arithmetic attached.
Google's recommended fix requires two windows to both exceed the burn rate threshold before anything fires. A long window supplies inertia, so a transient spike doesn't trigger a page on its own, while a short window allows fast recovery: once the underlying issue clears, the alert resolves without waiting for the long window to drain out.
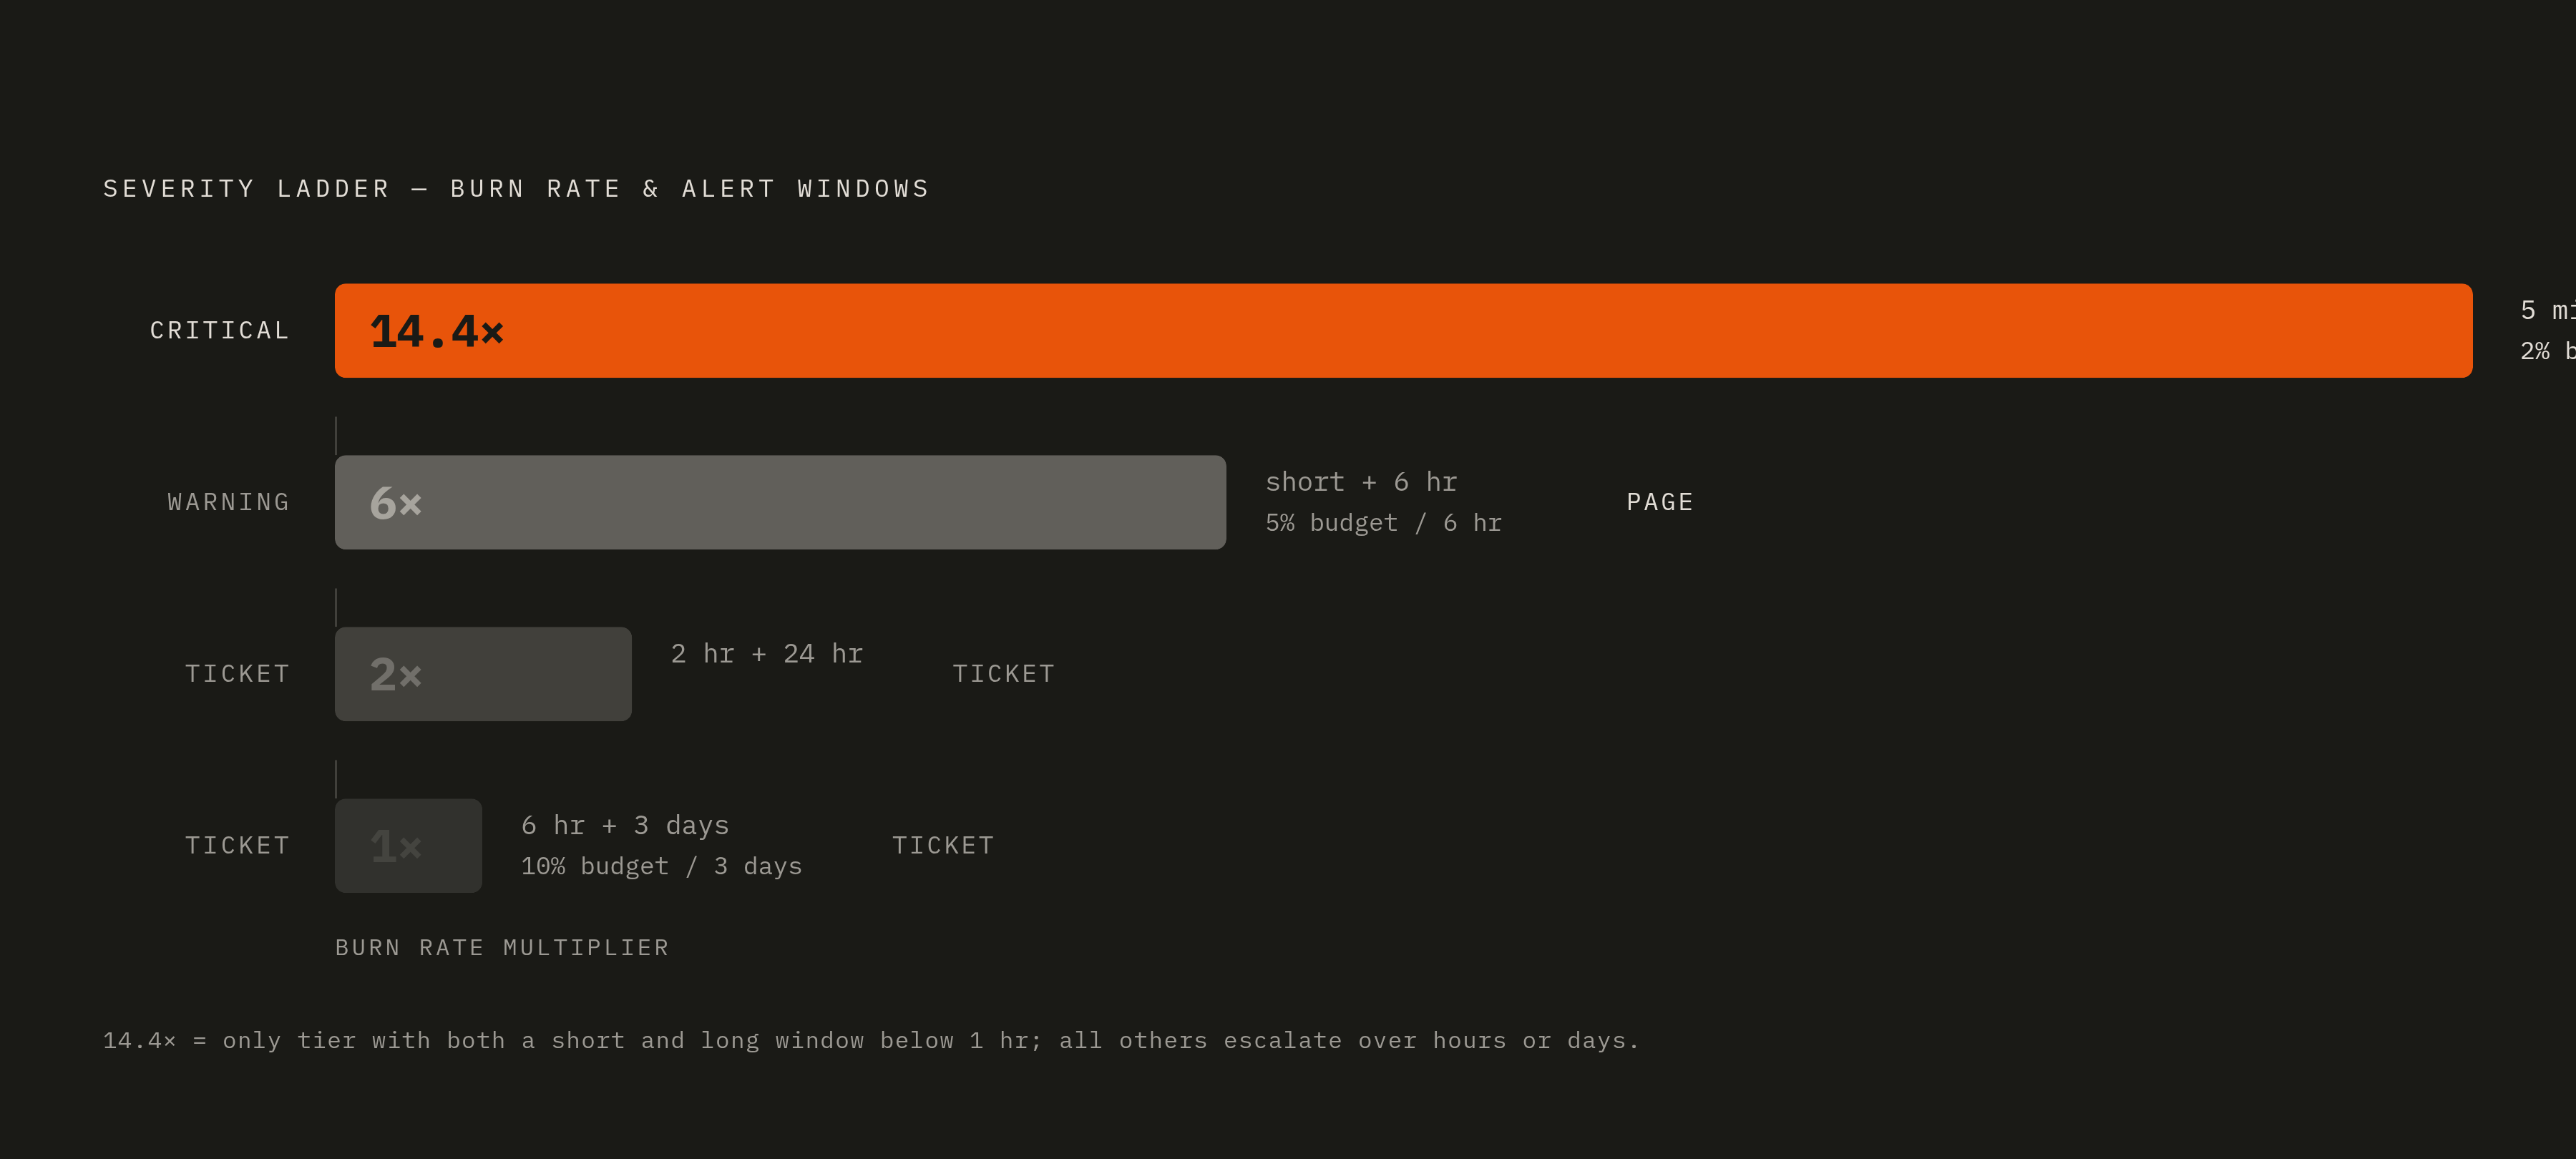
Current practice, as of 2025 and 2026, has settled into a four-tier severity ladder built on this logic. A short window paired with a 1-hour window, mapping to a 14.4x burn rate on a 30-day SLO, pages as critical, while a longer short window paired with a 6-hour window, at a 6x burn rate, pages as a warning. A 2-hour window against 24 hours, and a 6-hour window against 3 days, both route to tickets rather than pages. Google's SRE Workbook offers starting thresholds along these lines too: 2% budget consumption within one hour and 5% within six hours as paging triggers, with 10% consumption over three days as a baseline for ticket-level escalation.
None of these numbers are universal law. They're calibrated starting points, and teams running different SLO windows or different error budget policies will adjust the multipliers, not the underlying logic. Splunk Observability Cloud implements multiwindow, multi-burn-rate alerting natively along these lines, with the short window typically set as a fraction of the long window, following Google's original recommendation. The property this buys you is simple to state and hard to overstate: high-severity alerts fire with real urgency, low-severity burn gets routed to a ticket instead of a pager, and severity is earned by the math instead of guessed at by whoever happened to write the alert rule.
Why burn rate alerts catch what looks fine until it isn't — the post-deploy scenario
The most dangerous stretch of a service's life is the window right after a deploy. Code is new, real traffic is hitting it for the first time, and the green checkmark from CI is already stale information.
Threshold alerts tend to stay quiet through this window, particularly when the regression is bad but not catastrophic. Elastic Observability Labs documented a case where two bad rollouts burned 88% of a 30-day error budget while the headline SLI still read 99.56%, a number that looks like a service in good health by almost any conventional read. Underneath that number, a 26x burn rate alert was firing. The metric that looked like reliability was misleading, since 99.56% doesn't look like an emergency to a system with no concept of budget or rate.
Burn rate alerts give teams a signal while there's still budget left to act on, which is the entire point of firing early rather than waiting for the number to look undeniably bad. Google's SRE Workbook frames canary releases explicitly in these terms: rolling out to 1% of users while burning budget at a 1% rate gives a service roughly 43 minutes before the budget's exhausted, which turns the rollout decision into arithmetic rather than a judgment call made under pressure. The pattern taking hold across 2025 and 2026 practice reflects this directly, with dual-window burn rate watchdogs wired straight into automated rollback in canary pipelines. Release gradually, retreat fast, as a property the system enforces rather than a discipline someone has to remember to practice.
This is the gap tools like OnePatch sit in: automatically verifying pull requests against real production telemetry after deploy, catching the burn rate signal that a merge-and-hope workflow has no way of seeing until a customer complains.
What burn rate alerting does to on-call volume — and what that actually means for the engineers receiving the pages
Threshold alerting, run at scale, produces volume. Practitioner reporting from moabukar.co.uk describes threshold setups generating hundreds of alerts a week, the overwhelming majority requiring no real action from anyone. Burn rate alerting, properly tuned, brought that down to approximately five actionable alerts per week.
That reduction matters for reasons beyond comfort. Alert fatigue is a rational response to a system that cries wolf often enough that the signal stops being trusted, rather than a discipline failure on the part of the on-call engineer. Once engineers stop trusting the pager, both time-to-detect and time-to-recover grow, because the first response to any alert becomes skepticism rather than action. Human attention is the one truly scarce resource during an incident, and every alert that didn't need a response spent some of it anyway.
Burn rate enables a triage that happens before anyone even opens the alert. A high burn rate at the critical tier means the budget could be gone in hours, and that's a fire, page now, while a low burn rate sitting at the ticket tier is a slow bleed that needs attention this week, not this minute. This matters even more once a company runs a hundred microservices, where setting custom threshold parameters per service accumulates into cognitive load that nobody scales past. Standardized SLOs with burn rate multipliers make the alerting logic uniform across every service, instead of bespoke per team.
There's a morale dimension underneath all of this that's easy to treat as soft and isn't. On-call that pages people for nothing, repeatedly, drives attrition. Restoring trust in the pager is a retention variable and a reliability variable at once, not a quality-of-life nicety tacked onto the reliability conversation.
How error budget policy converts the velocity-vs.-reliability argument from a debate into a decision rule
Every engineering org has some version of the argument: we need to ship faster, set against we need to be more stable. Without an error budget, there's no shared ground underneath that argument, and it usually gets resolved by whoever's more senior or more persistent in the room.
Error budget policy makes the argument unnecessary by writing the rules down in advance, before anyone's under pressure to make a call in the moment. A practical version of this policy is tiered directly off burn rate health. Budget mostly intact means normal deployment velocity, because the math says there's headroom, while budget partially consumed means cautious deploys and mandatory staging validation. Budget significantly depleted means a shift toward reliability work and deferring risky changes, budget nearly exhausted triggers a feature freeze and escalation, and budget at zero means emergency fixes only, full stop.
What changes once this is written down is that the on-call engineer stops making a judgment call under pressure. The burn rate tells them, directly, which policy tier the team is in. This has real implications for AI-assisted and agentic deployment workflows, since an agent can track burn rate continuously and decide whether to continue, pause, or roll back a change based on live SLO health, executing the policy rather than just referencing it. Emerging practice describes this as AI turning error budgets into a dynamic control system. That control system, though, is only as good as the alerting signal feeding it, and a threshold alert can't tell an agent, or a human, which policy tier applies, since it carries no budget context at all.
Burn rate alerts in a world of AI-generated code shipped at agent speed
LangChain's 2026 State of Agent Engineering report puts 57.3% of organizations with agents already running in production, and 32% naming quality as their primary barrier, quality here meaning unpredictable output once the code meets real conditions rather than a test suite.
AI-generated code changes the alerting calculus in a couple of specific ways. Code ships faster than a human review cycle can reasonably keep pace with, shrinking the window between deploy and discovery to something threshold alerting was never built to operate inside, and the output is also non-deterministic in a way that makes regression tests less reliable as a proxy for real production input, because tests that passed yesterday may not cover the distribution of inputs a live agent actually sees.
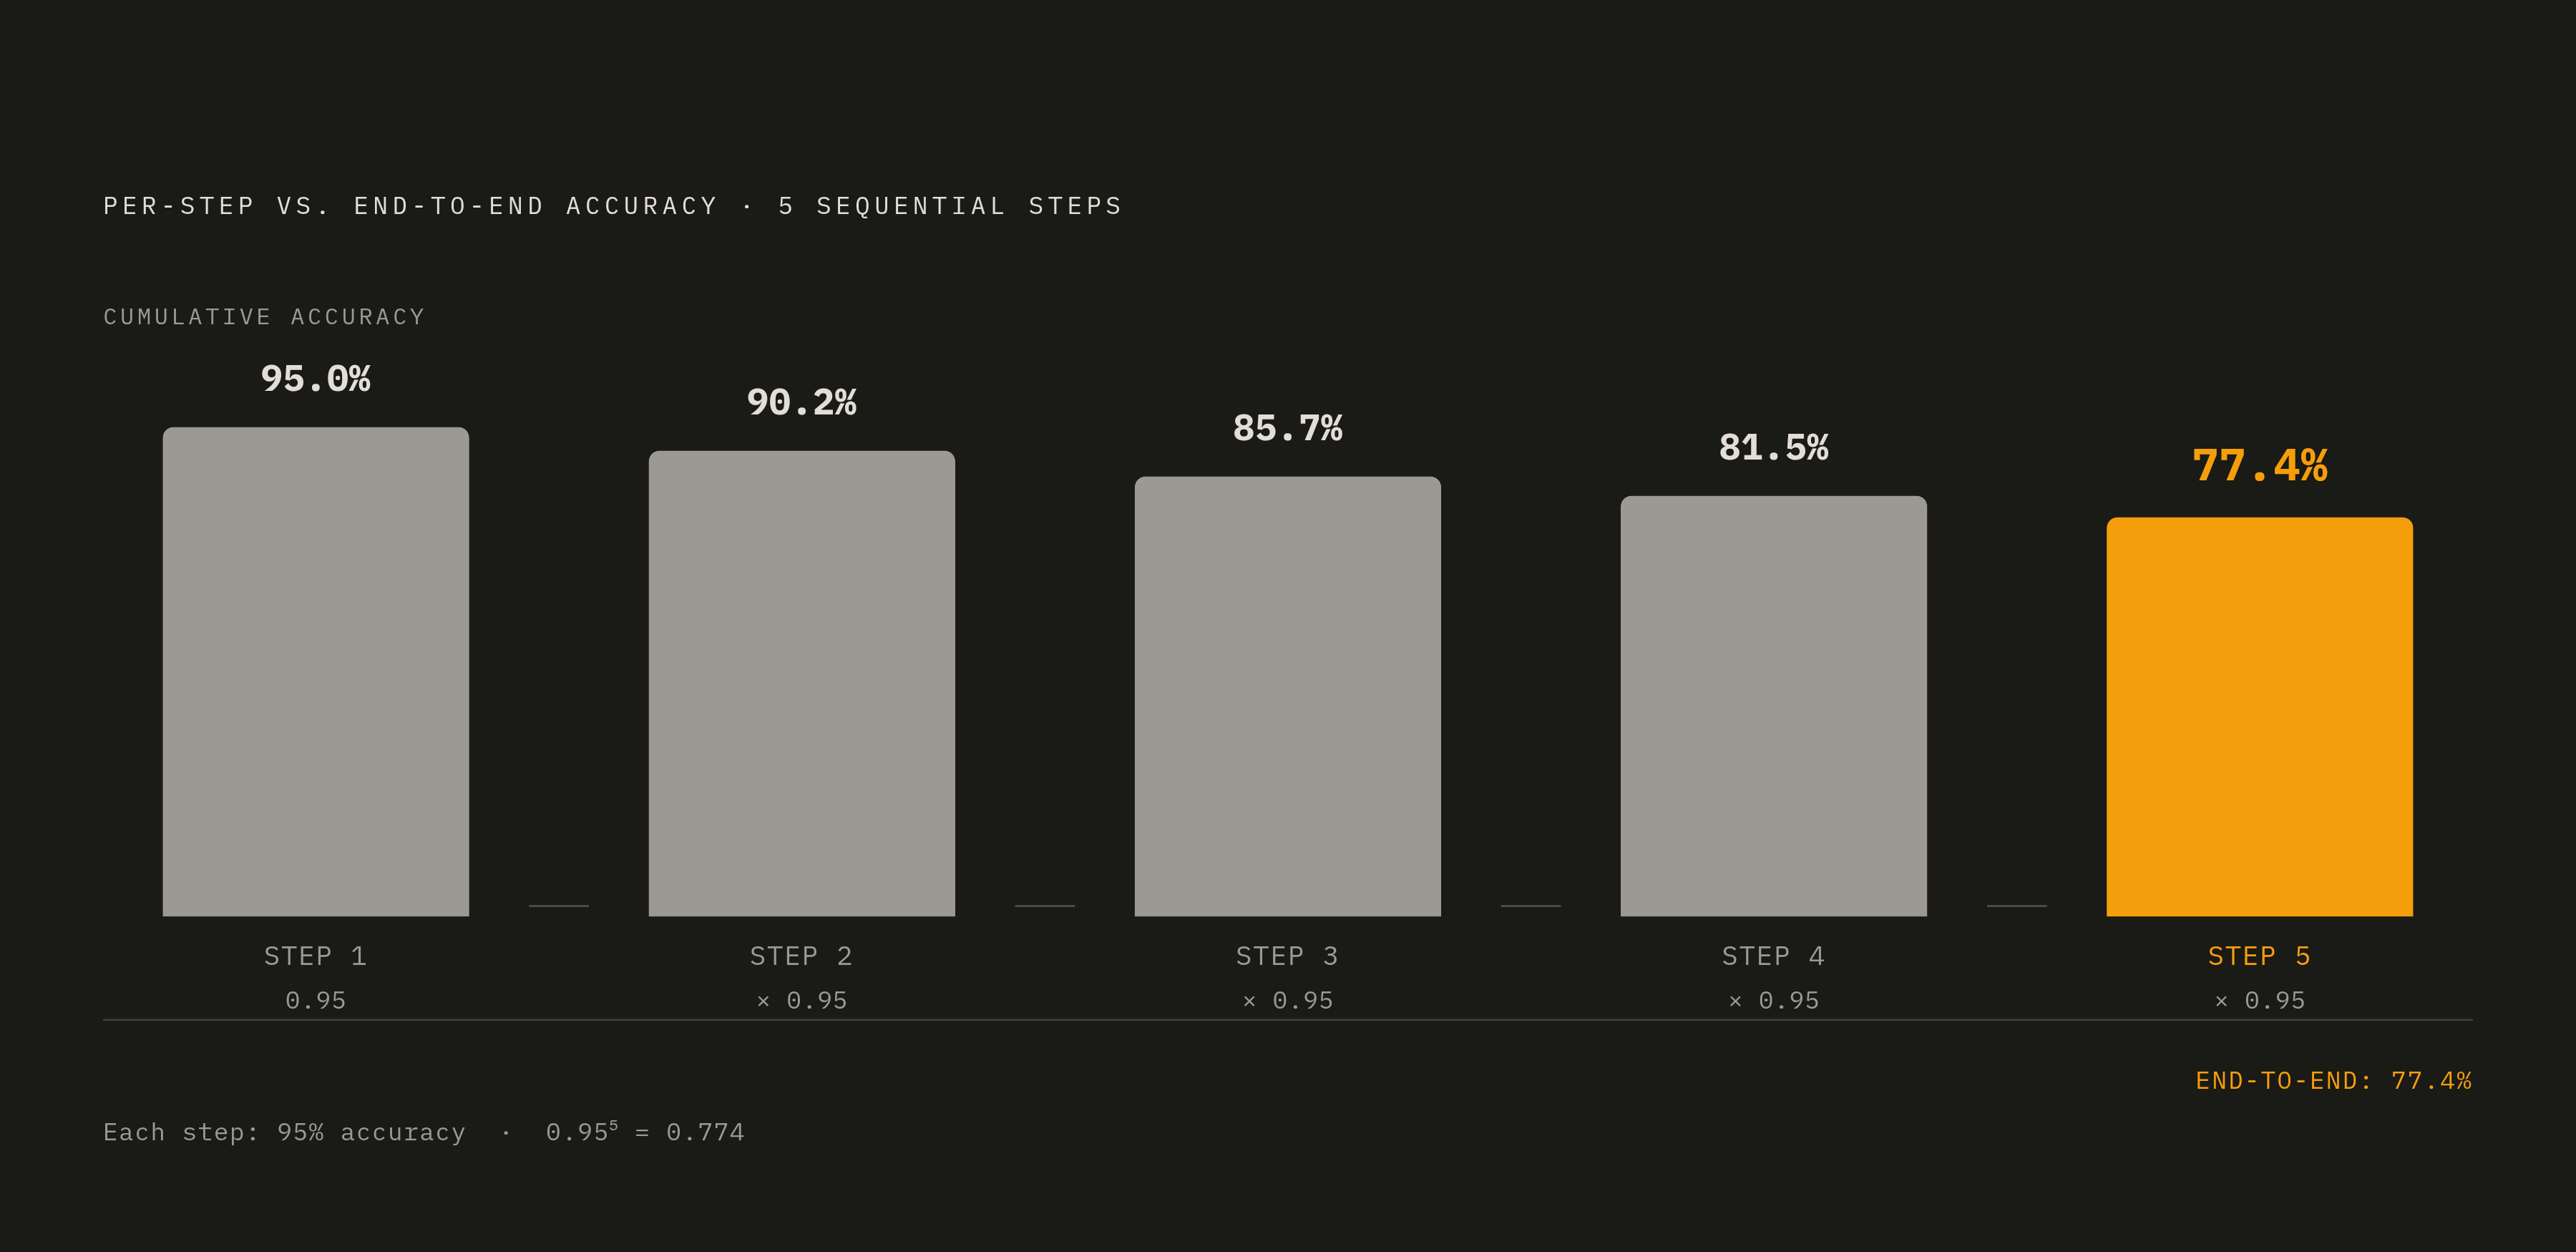
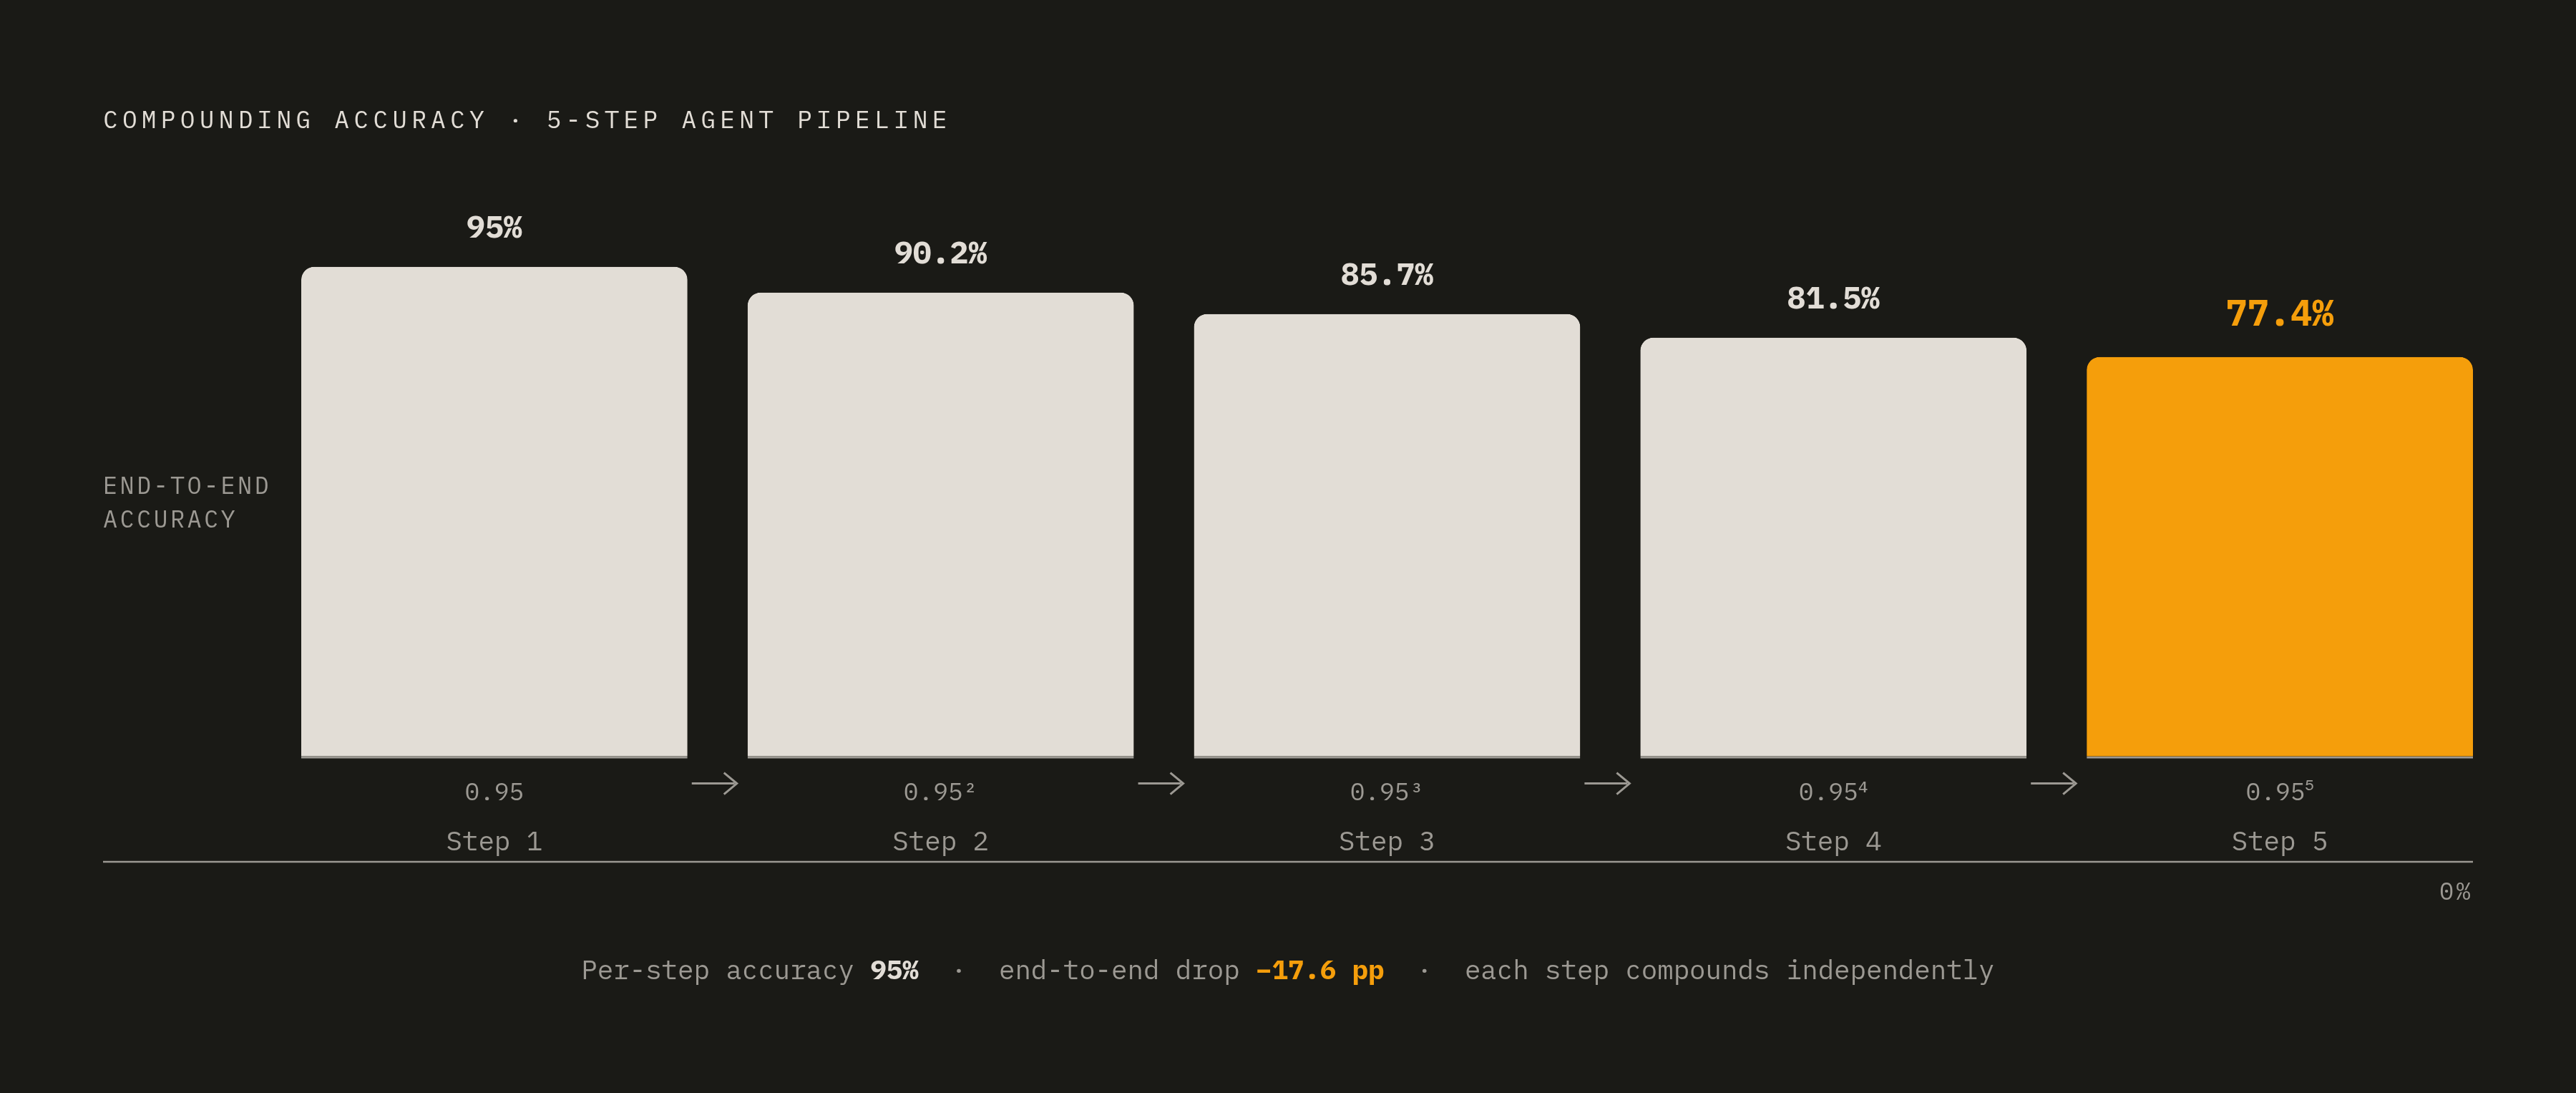
Multi-step agent pipelines compound this. A per-step accuracy of 95%, chained across 5 steps, yields an end-to-end accuracy of 77.4%, arithmetic that most teams underestimate until they see it written out. This means per-step SLOs have to be set well above the end-to-end target, and burn rate needs independent tracking at each step, not just at the pipeline's final output. Threshold alerts are especially poorly matched to this environment, because they have no way to distinguish a momentary model hiccup from a structural regression, and no mechanism for weighting the user impact of a failure that cascades across several agent steps at once.
Burn rate alerts, paired with continuous monitoring, surface the question that actually matters here: is the end-to-end reliability promise being consumed faster than the budget allows, regardless of which step is responsible. OnePatch's position in this environment is direct: automated production verification sitting between the pull request and the live environment, checked against real telemetry at the speed agentic development demands, turning the burn rate signal into an automated check rather than something a human remembers to look at after the fact. None of this replaces a human for the decisions that matter most; burn rate can trigger automated rollback in low-risk canary stages and can escalate severity recommendations backed by evidence, but production changes in high-risk environments still need a person to approve them.
From burn rate alert to traced root cause without switching tools
Burn rate alerting tells you the budget is burning and how fast. It does not, by itself, tell you why, and that gap is where a lot of incident time actually gets spent.
The investigation an alert should launch follows a natural sequence. The alert fires, and severity is already established by the burn rate multiplier that triggered it. From there: which SLI is actually driving the burn, which dependency is failing, and which traces correspond to the bad events showing up in that SLI. Elastic Observability's 2026 redesign connects the burn rate alert detail page directly to the SLI, the event log, and the trace waterfall, letting an engineer compare good and bad spans side by side and follow the failing hop into the trace without ever leaving the alert's context.
The cost of not having this wired together is straightforward: every extra tab opened during an outage is time the SLO keeps burning while someone hunts for the root cause across five different dashboards. The investigation itself starts eating the same budget the alert was raised to protect. Automated incident response tied to burn rate closes some of that gap; a high-burn alert can launch a structured response in seconds, with severity already declared, responders assembled, and the relevant dashboards and playbooks attached, without anyone doing manual triage first. Summaries, timeline construction, diagnostic collection, and related-incident detection are all reasonable to automate. Production changes and anything customer-facing still need a human signing off.
Burn rate alerts function as the entry point into a faster, more structured response that doesn't scatter across a dozen tools mid-incident. The alert itself carries context a threshold alert never had, and that context is the whole reason it's worth the switch.