What Observability Means in Software Delivery Pipelines
A green build proves nothing about how code behaves in production.
A build passing tells you an artifact compiled, but it says nothing about what that artifact does once real traffic hits it, and most teams still treat the two as the same event. The gap between them is where a lot of production incidents quietly live.
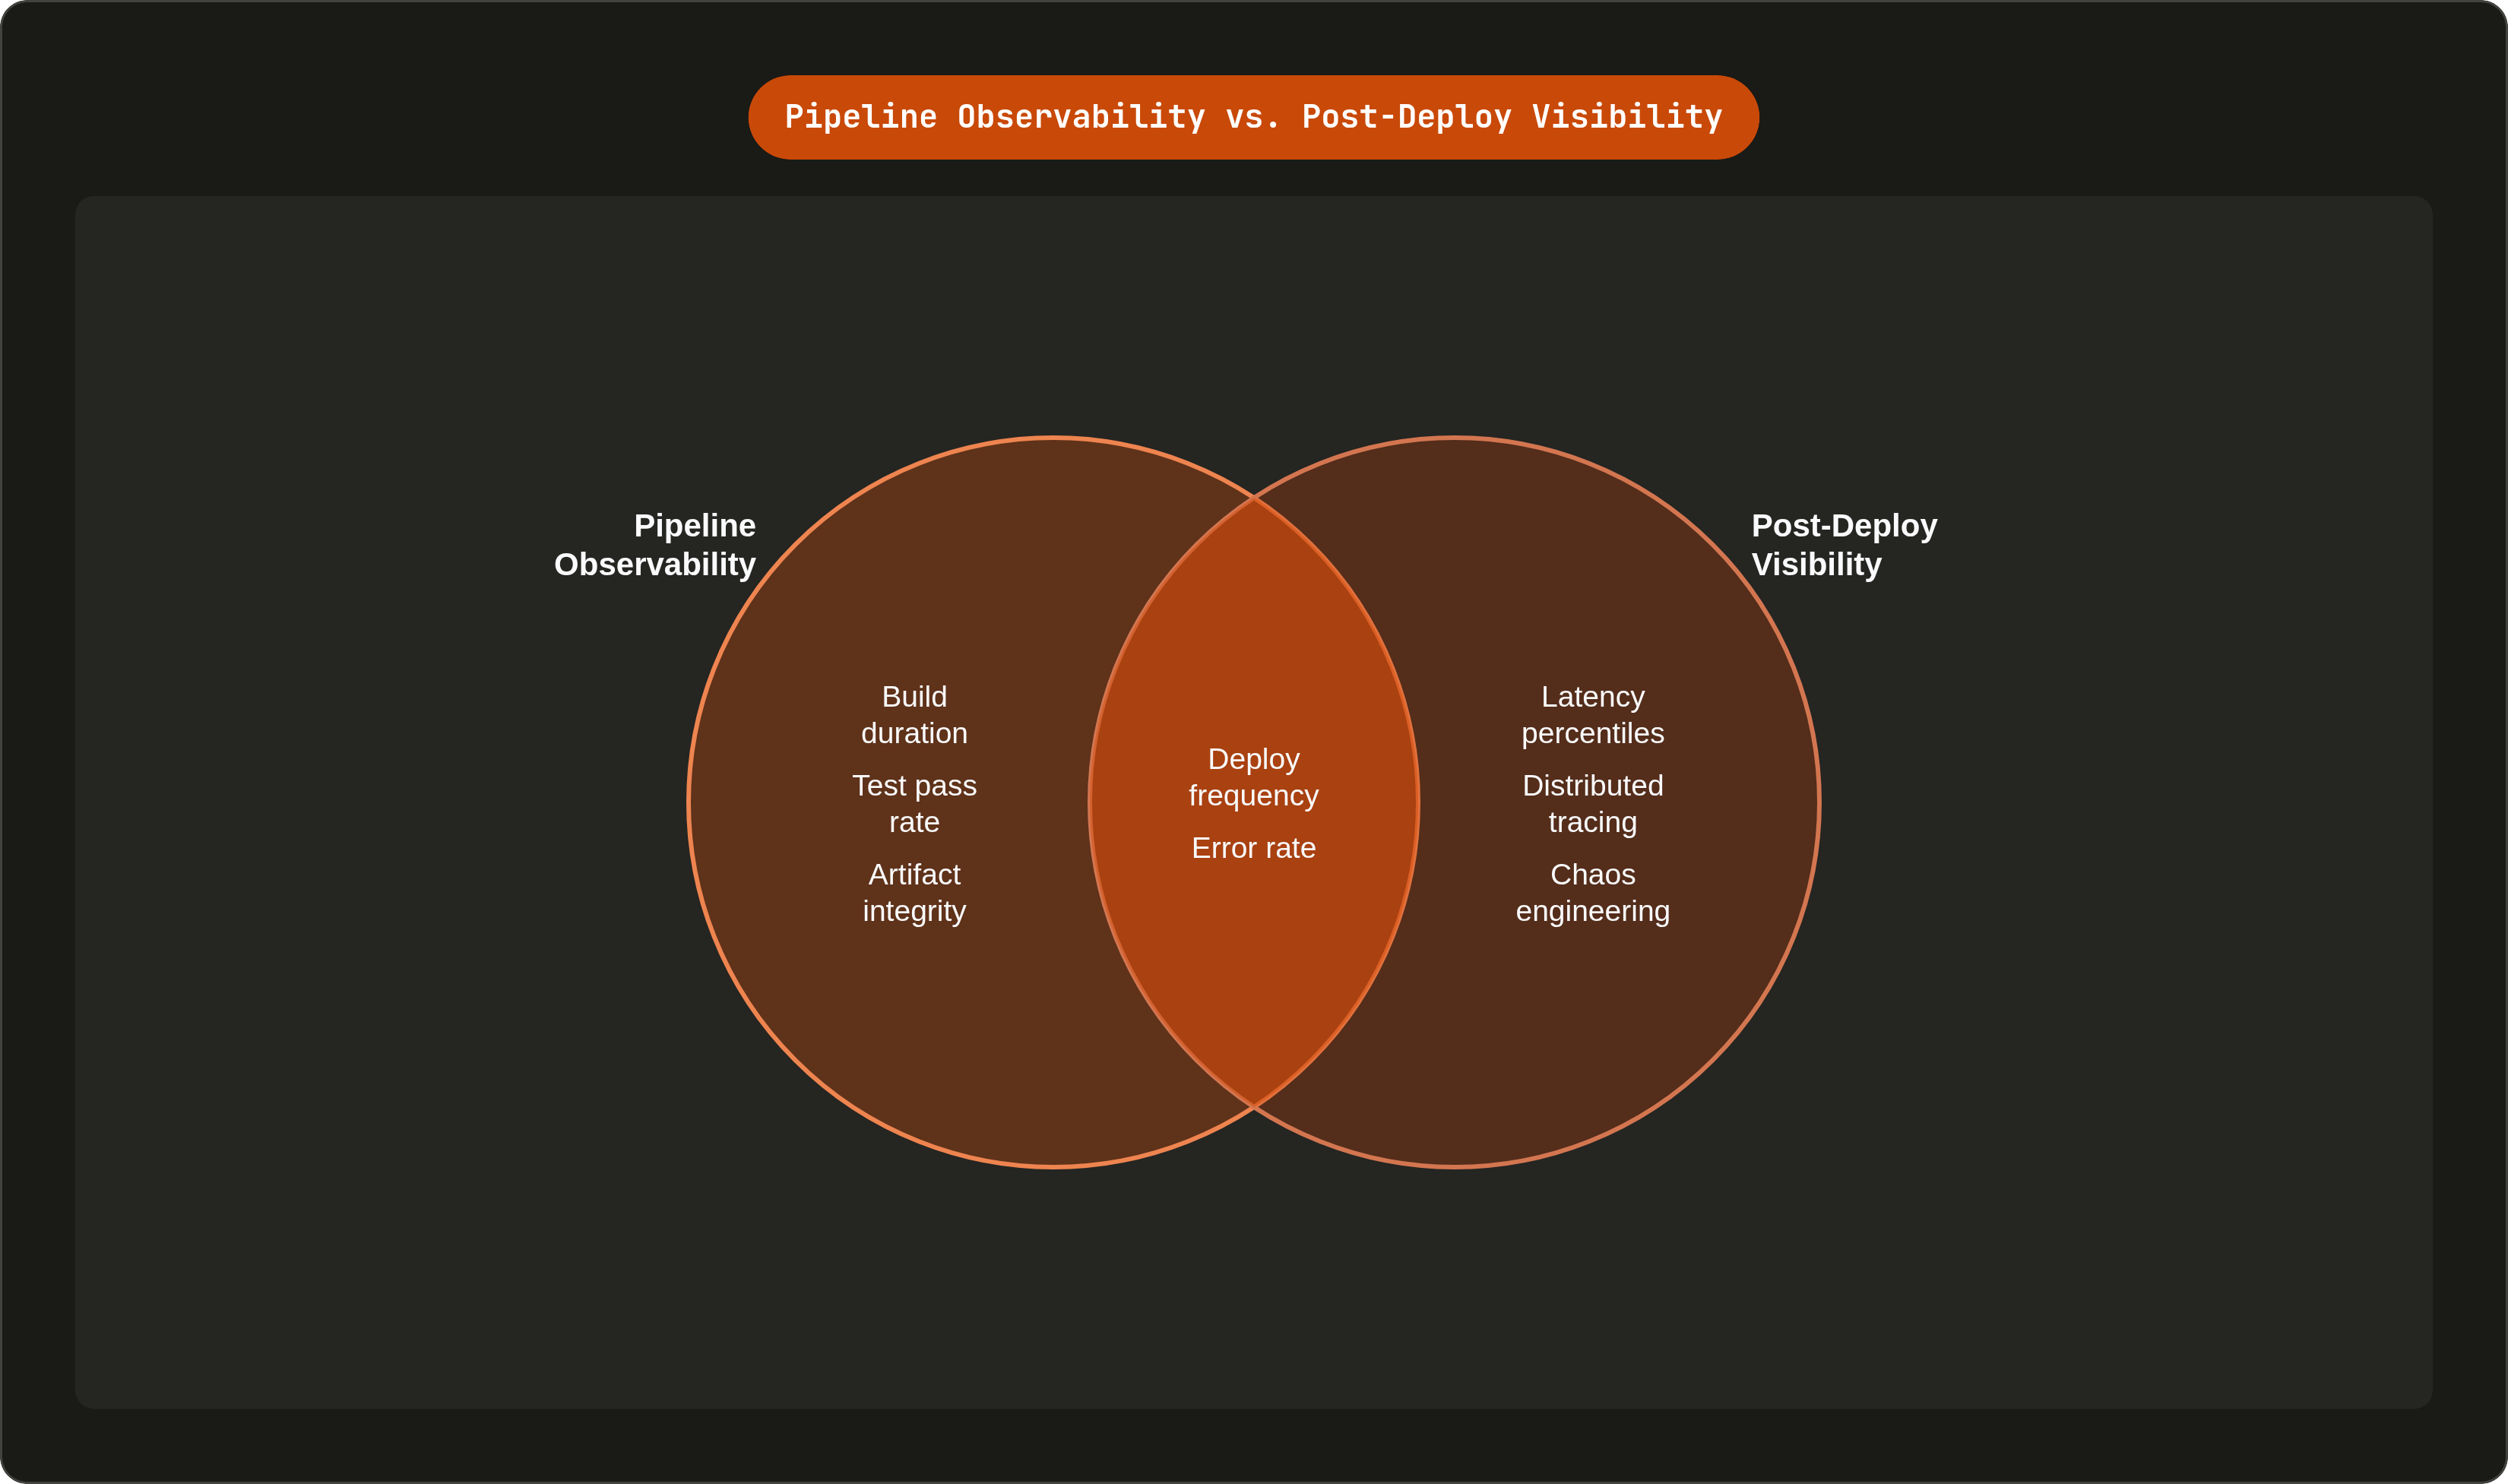
The word "observability" gets used for two different jobs that happen to share a dashboard. One job watches the pipeline: build duration, test pass rate, deploy frequency. The other watches the software after it ships, once actual users are pushing real requests through it. A green CI run feels like proof that everything worked. In reality it only proves the build didn't error out, which is a much smaller claim than most engineers give it credit for.
Control theory had this sorted out before software needed it. Observability, in the original sense, is how well you can figure out a system's internal state just from watching its outputs. Applied here, the system in question is the running production environment, not the pipeline that built it. The pipeline delivers code; production is where that code actually lives or dies. Passing a build and verifying a deployment are separate acts, and most teams stop after the first one.
What telemetry the pipeline itself actually exposes, and where it goes blind
Pipeline telemetry gives you build duration, step failures, test coverage numbers, artifact integrity checks, a pass/fail flag on the deploy. Real signals, all of them. They'll tell you if a build step is timing out or if your test suite has quietly started rotting.
There's a lot they won't tell you, and that's the part that matters. They can't tell you if the code behaves correctly once real traffic hits it, and a regression sitting in a code path your tests never touched will sail right through. Nothing in a green pipeline run tells you whether latency or error rate moved after the last deploy, and nothing tells you that a dependency is behaving differently in production than it did in staging, which happens more often than teams like to admit.
Staging approximates this, but only partially. You can approximate the shape of production traffic in staging, but you can't fake real volume, real data distributions, or the years of accumulated state a live system carries around. The 2025 DORA research puts it in numbers: only 8.5% of teams hit elite change failure rates of 0 to 2%, while 39.5% sit above 16%. Pipeline observability matters, but it isn't sufficient on its own. It tells you the car started; it says nothing about whether it drives straight once it's out on the road.
The four kinds of telemetry that make post-deploy visibility actually work
Post-deploy visibility runs on four kinds of telemetry: metrics, logs, traces, and events. People shorten it to MELT. Each one catches something the others miss, and none of them substitute for another.
Metrics are numbers aggregated over time, error rates, latency percentiles, throughput. Fast to read, low resolution: a metric tells you something moved, not why. Logs fill part of that gap. Once traffic hits a new deploy, application logs are usually the first place anyone looks, and automated log analysis can scan for spikes in 4xx and 5xx responses, grouped by likely root cause. Traces go deeper still. Distributed tracing follows a single request across service boundaries, and in a chain of six or eight services, that's often the only way to find where a failure actually started rather than where it showed up. Events supply context: a deployment marker, a feature flag flip, a config change. An event is what turns an unexplained spike on a graph into a spike with a cause attached.
None of the four does much by itself. The value shows up in correlation, in the moment someone asks whether a metric shift lines up in time with a specific deploy. That question, asked fast, is most of what observability is for. And instrumentation only pays off if it's built into the feature from day one, metrics and traces defined as part of shipping the code, not bolted on after an incident exposes a blind spot nobody planned for.
How teams actually check a deployment once it's live
There's a handful of overlapping techniques here, and each trades fidelity for cost differently. Smoke testing after deploy is the cheap end: lightweight automated checks confirming core functionality survived the release, fast enough to catch obvious breakage before it becomes an incident. Synthetic monitoring goes further, running scripted logins, searches, checkouts continuously against production, which catches regressions that only surface under realistic usage patterns.
Release verification against live traffic costs more but tells you more: it confirms APIs and core services behave under actual usage, with performance monitoring tracking latency and error rate as real users show up. Feature flags add another layer entirely. They separate deployment from release, which means gradual rollout and instant rollback without a redeploy, and watching flag-level performance (the latency a given flag state adds, say) is turning into its own discipline. Chaos engineering sits at the far end: deliberately breaking things in production, killing service instances, injecting network latency, to see if the resilience mechanisms actually hold. Netflix's Chaos Monkey and Amazon's GameDay exercises are still what most engineers point to when they explain the idea to someone new.
None of these compete. A mature team runs several at once, because each one ties a post-deploy signal back to the specific change that caused it. The deployment becomes the thing you verify, and the thing you shipped and hoped for the best on becomes a smaller part of the story. OnePatch, for instance, compares post-deploy telemetry against pre-deploy baselines automatically for every pull request, which makes verification a required step instead of something a busy engineer means to get to.
When telemetry turns into noise instead of signal
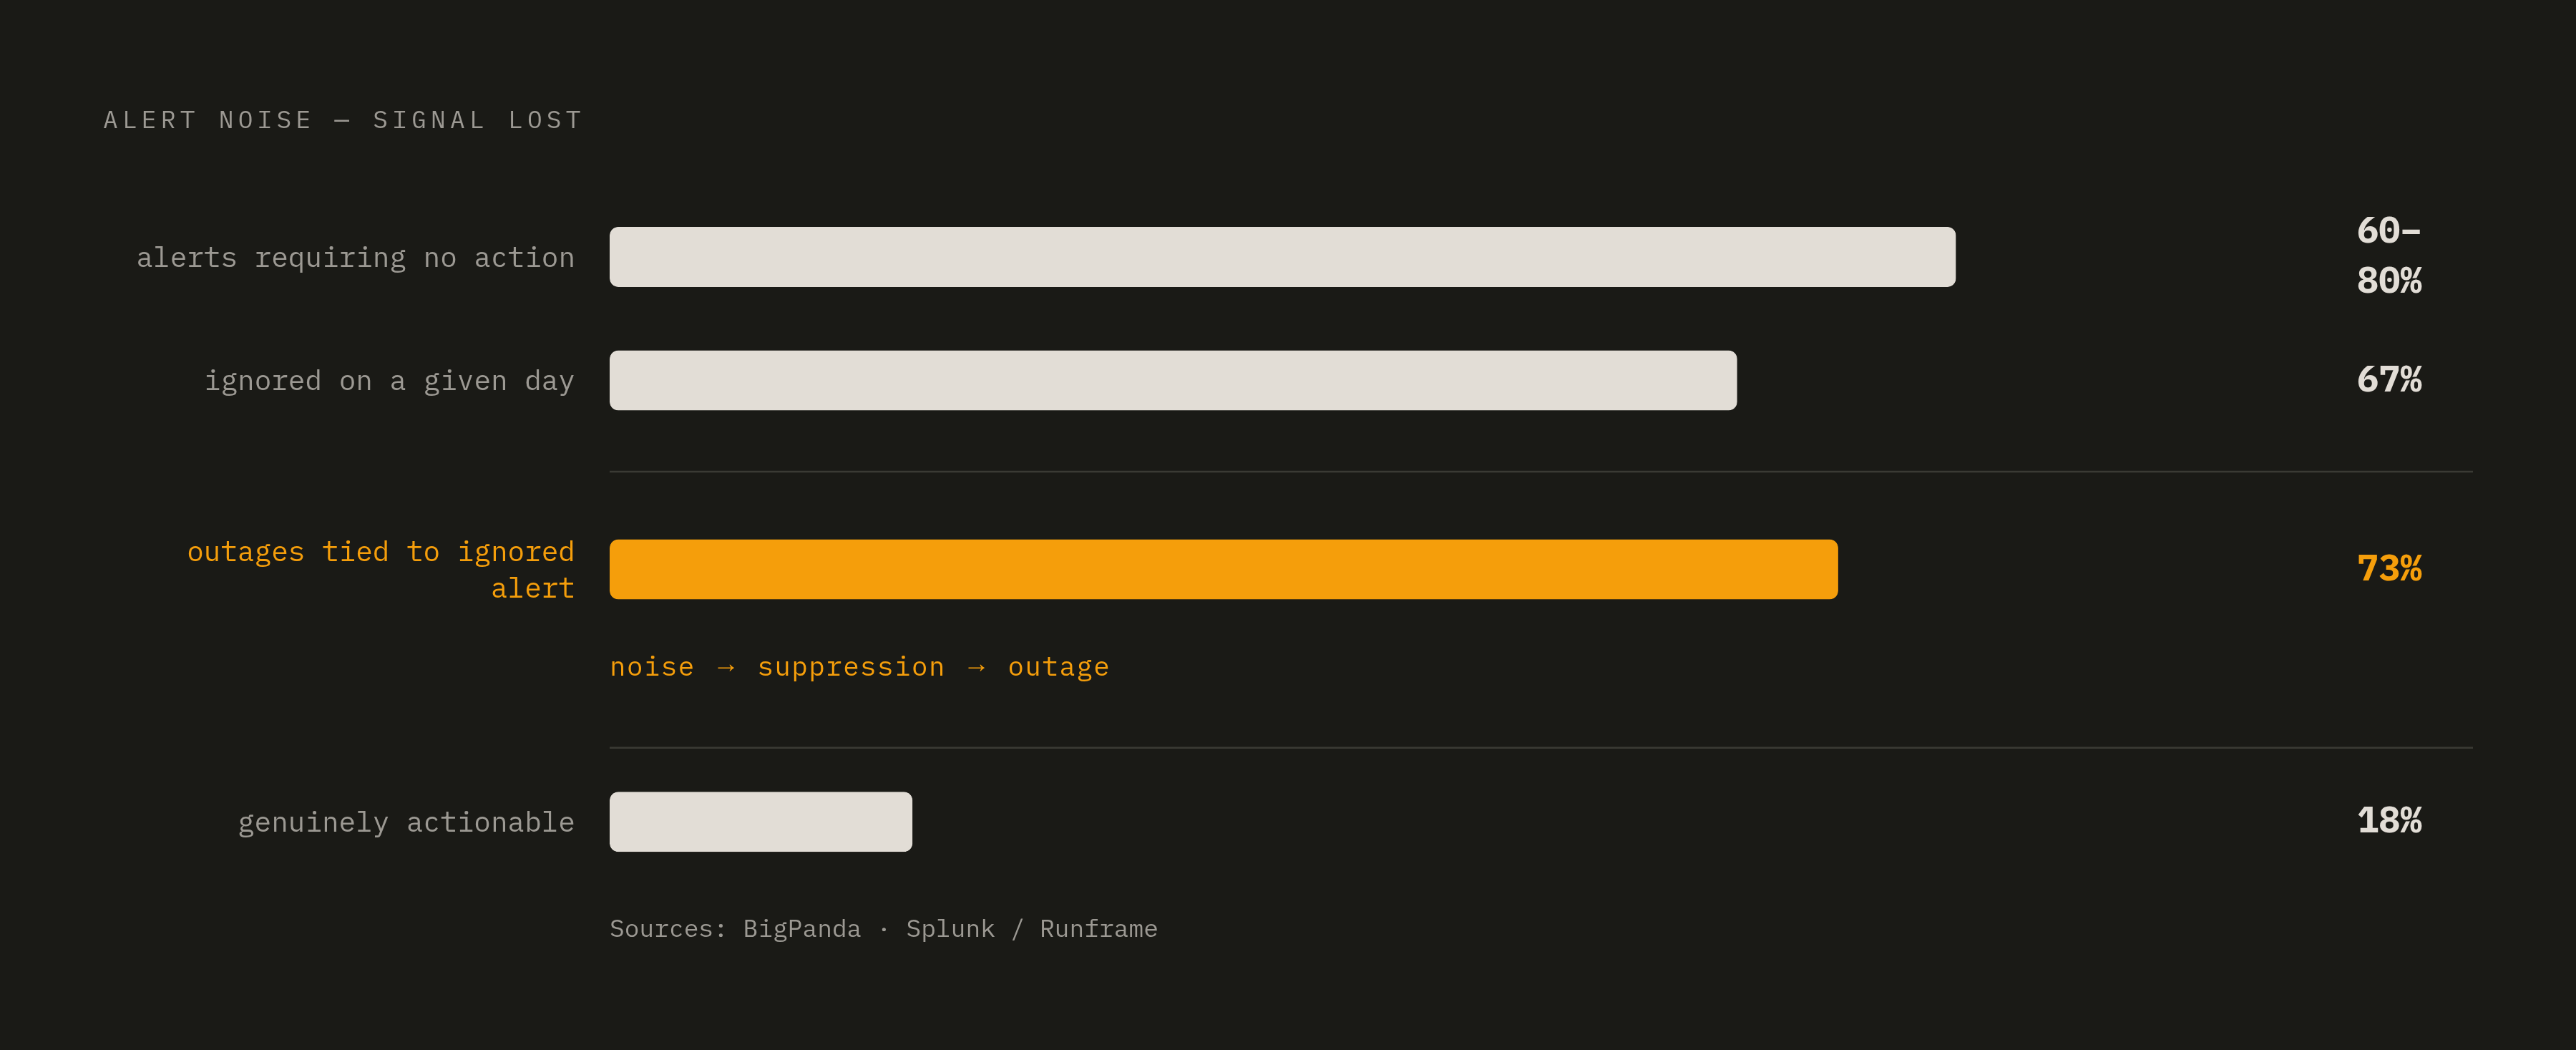
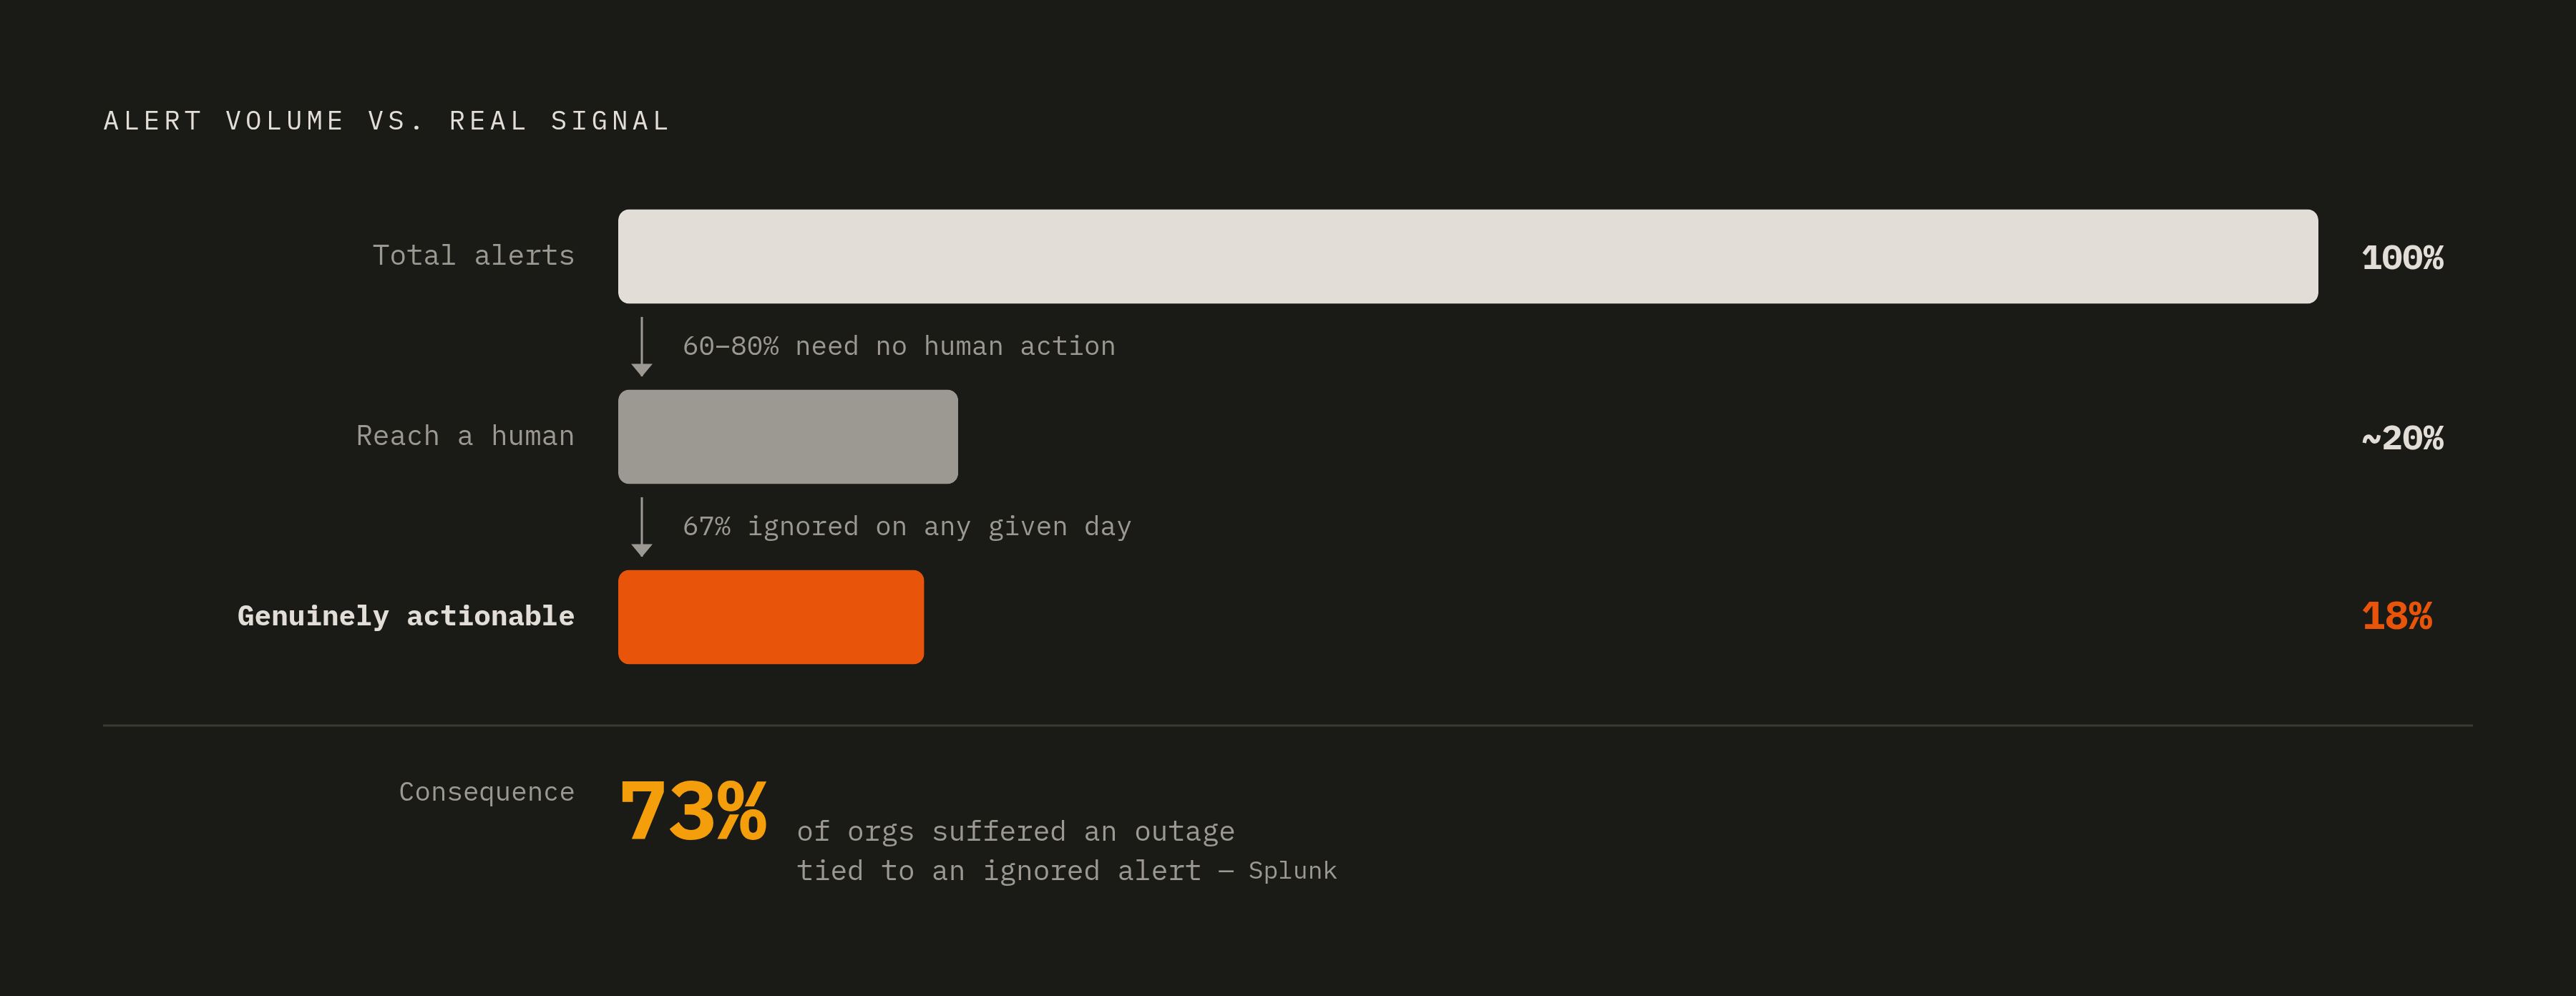
Here's the part nobody likes admitting: teams spend real money building all this observability, then drown in what it produces. Somewhere between 60% and 80% of alerts in a typical environment need zero human action, duplicates, downstream symptoms of one root cause, things that resolve on their own in a few minutes. BigPanda's Monitoring & Observability Report puts genuinely actionable incidents at 18%.
The cost isn't theoretical. According to Splunk research cited by Runframe, 73% of organizations had an outage tied to an alert that got ignored or suppressed, and 67% of alerts go ignored on a given day. Catchpoint's SRE Report 2025 found close to 70% of site reliability engineers link on-call stress from alert volume directly to burnout and people quitting.
Teams tend to treat alert fatigue as a discipline problem, something a better on-call rotation or more caffeine will fix. The deeper issue is signal design. When every alert says urgent, none of them are, and shipping more telemetry without shaping it into something worth reading just makes the noise louder. Apica's tooling shows how much slack there actually is here: deliberate filtering can cut Kubernetes log volume by up to 85% without dropping a single error, warning, or business-critical event.
Cutting the noise without cutting the signal
The principle is easy to state and hard to execute: teams need telemetry that's relevant and dense with meaning, not just more of it. "Send everything to the pipe" works fine at small scale and falls apart the second real traffic shows up.
A few techniques genuinely help. Alert correlation groups downstream symptoms under one root cause, so a single service failure produces one ticket instead of thirty separate pages. Hybrid correlation, rules plus machine learning working together, consistently beats either approach alone, but only if a human still reviews correlation rule changes before they go live. Skip that review and false negatives creep in fast. Deployment-scoped alerting anchors thresholds to the most recent release baseline instead of some static number set once and forgotten, since what counts as anomalous shifts every time you ship. Suppression and deduplication clear out the alerts everyone already knows will resolve on their own inside a set window.
Where teams put in this work, the numbers are large. BigPanda reports 82% of customers in one study hit at least 97% noise reduction, and over half cut noise by 99.5 to 99.9%. That's close to the ceiling of what correlation done well can achieve. Tool sprawl works against all of it. Organizations juggling multiple tools during an incident are adding cognitive load with every extra browser tab someone opens while an SLO burns down, and a good chunk of the market's push toward consolidated platforms is a direct response to how badly fragmentation made this worse.
What AI-written code does to the stakes here
The velocity problem just got worse. 57% of organizations now run AI agents in production, up from 51% a year earlier, and 72% of enterprise AI projects involve multi-agent architectures, up from 23% in 2024, nearly tripling in twelve months. 92% of developers say AI tools have widened the blast radius of a potential incident: more code, moving faster, with less human review attached to any given change.
Two risks stack here, and they're different in kind. The first is straightforward: engineers ship AI-written code faster than review cycles can catch behavioral regressions, and the sheer volume of pull requests outpaces anyone's ability to check each one by hand against production behavior. The second is stranger. An AI agent acting as a production component can return a clean 200 OK while giving a wrong answer, burn through a token budget silently, or wander off the task it was given entirely, and standard application performance monitoring was never built to watch non-deterministic, tool-calling systems misbehave like that.
That mismatch shows up as a gap in what actually gets measured. Token consumption per request, model version drift, agent decision traces, GPU use per inference call: none of it is telemetry a conventional monitoring stack collects by default. The pattern emerging across teams is that incident detection hasn't kept pace with how fast agent fleets have grown. Agents are likely failing more than current monitoring surfaces, and that gap is increasingly understood as a detection problem, not an improvement. Put plainly: the faster code ships, the less optional automated post-deploy verification becomes, because human review can't scale to match how fast agentic development moves.
Building verification into the delivery loop itself
The model that actually closes this gap works like this: every pull request that deploys gets checked against production telemetry baselines automatically, before anyone calls the release a success. The deploy event triggers the check, and nobody has to notice something looks off and decide, on their own initiative, to go dig into it.
A verification step worth having runs on every deploy, not just the ones that look suspicious at a glance. It's scoped to the specific change, comparing telemetry drift against that pull request's own baseline rather than some static global threshold nobody's revisited in six months. Its output does something concrete: a reviewed fix pull request, arriving faster than a Slack thread that dies out after an hour, or a war-room call nobody wanted to join in the first place. And it has to cover the full MELT surface, latency, error rate, downstream service behavior, not just whether the service technically responds to a ping.
This is roughly the problem OnePatch is built around. It sits between pull requests and live production, checks every deployment against real telemetry, and opens fix pull requests on its own when something breaks, turning verification into a structural part of delivery rather than a task that depends on someone being on call and paying attention at 2 a.m. Catchpoint's SRE Report 2025 found operational toil rose to 30% from 25%, the first increase in five years, arriving right as AI pushes shipping velocity higher still. The gap between how fast teams deploy and how much verification capacity they actually have keeps widening.
Production telemetry is the only ground truth here. A green CI run tells you the artifact is valid, but production telemetry tells you whether the behavior is correct, and that's the question that actually decides whether the release worked. Teams that treat verification as automatic, rather than as something to get to when there's time, are the ones actually closing the loop that pipeline observability leaves wide open on its own. Services like One Patch, an AI agent that verifies every pull request against live production telemetry and opens fix PRs when post-deploy regressions surface, are built on exactly that premise.