Observability as Code Implementation Patterns
Versioning observability configs like code prevents alert fatigue and environment drift.
Observability as Code means managing instrumentation rules, alert definitions, SLO configs, and dashboards as version-controlled artifacts, the same way application code gets managed, rather than as clicked-through settings buried in a vendor's UI. The thesis here is simple: OaC is only as good as the telemetry it produces in production, and treating it as pure configuration hygiene misses the point entirely. This piece walks through the four core implementation patterns, what each one actually guarantees once real traffic hits, and where each one quietly stops guaranteeing anything at all.
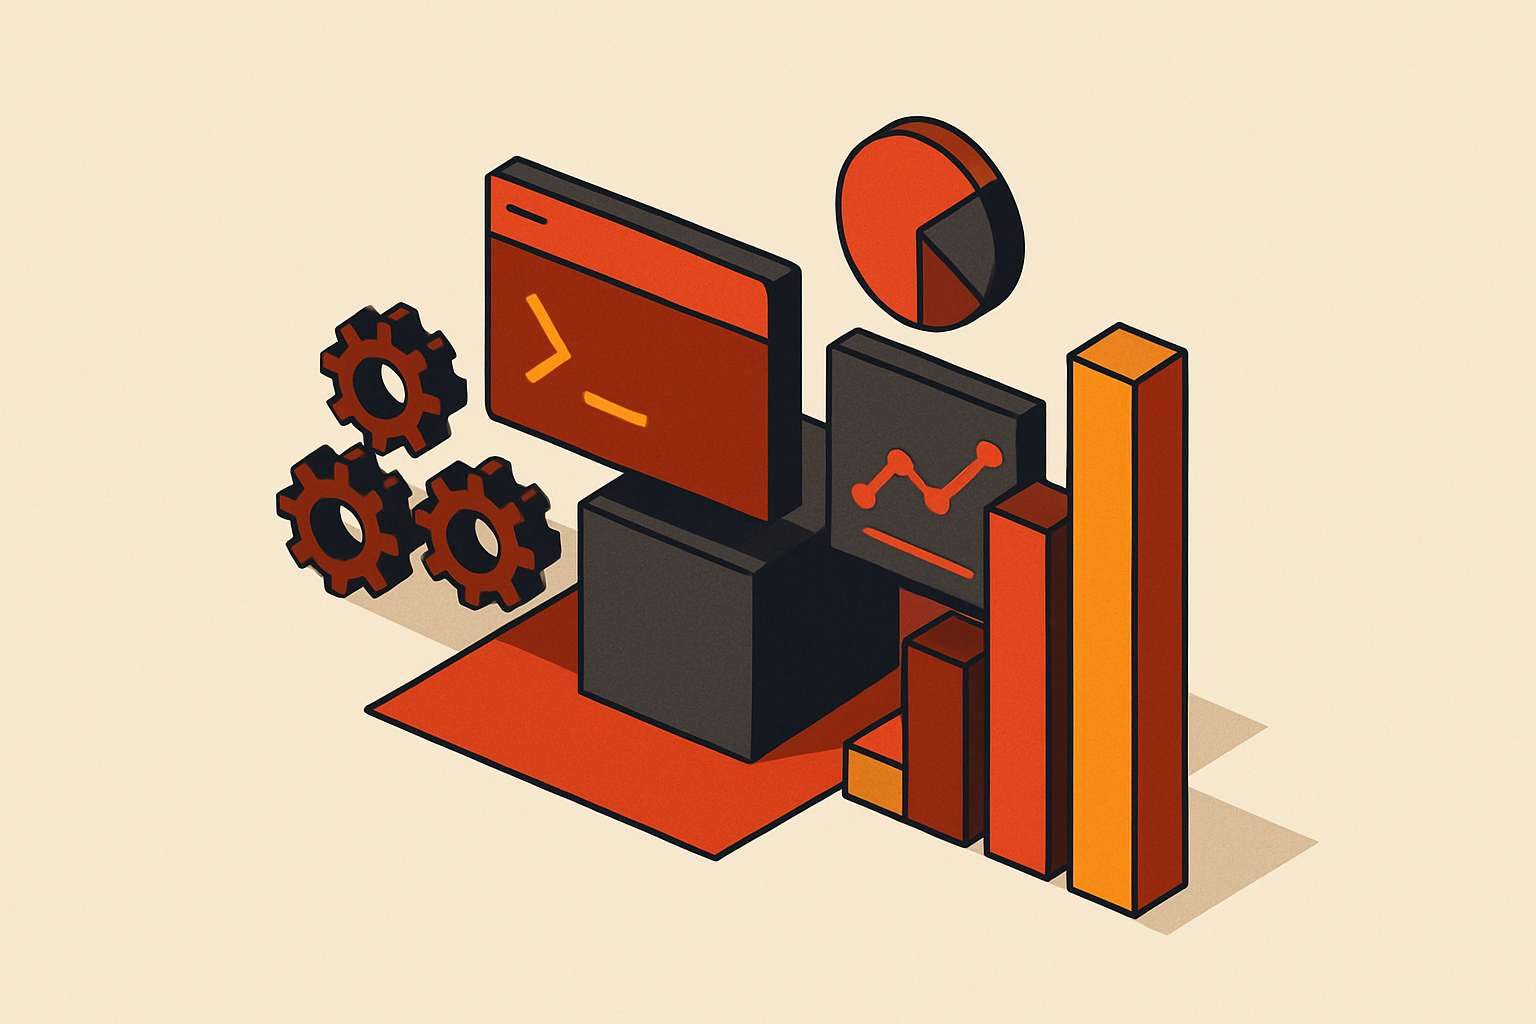
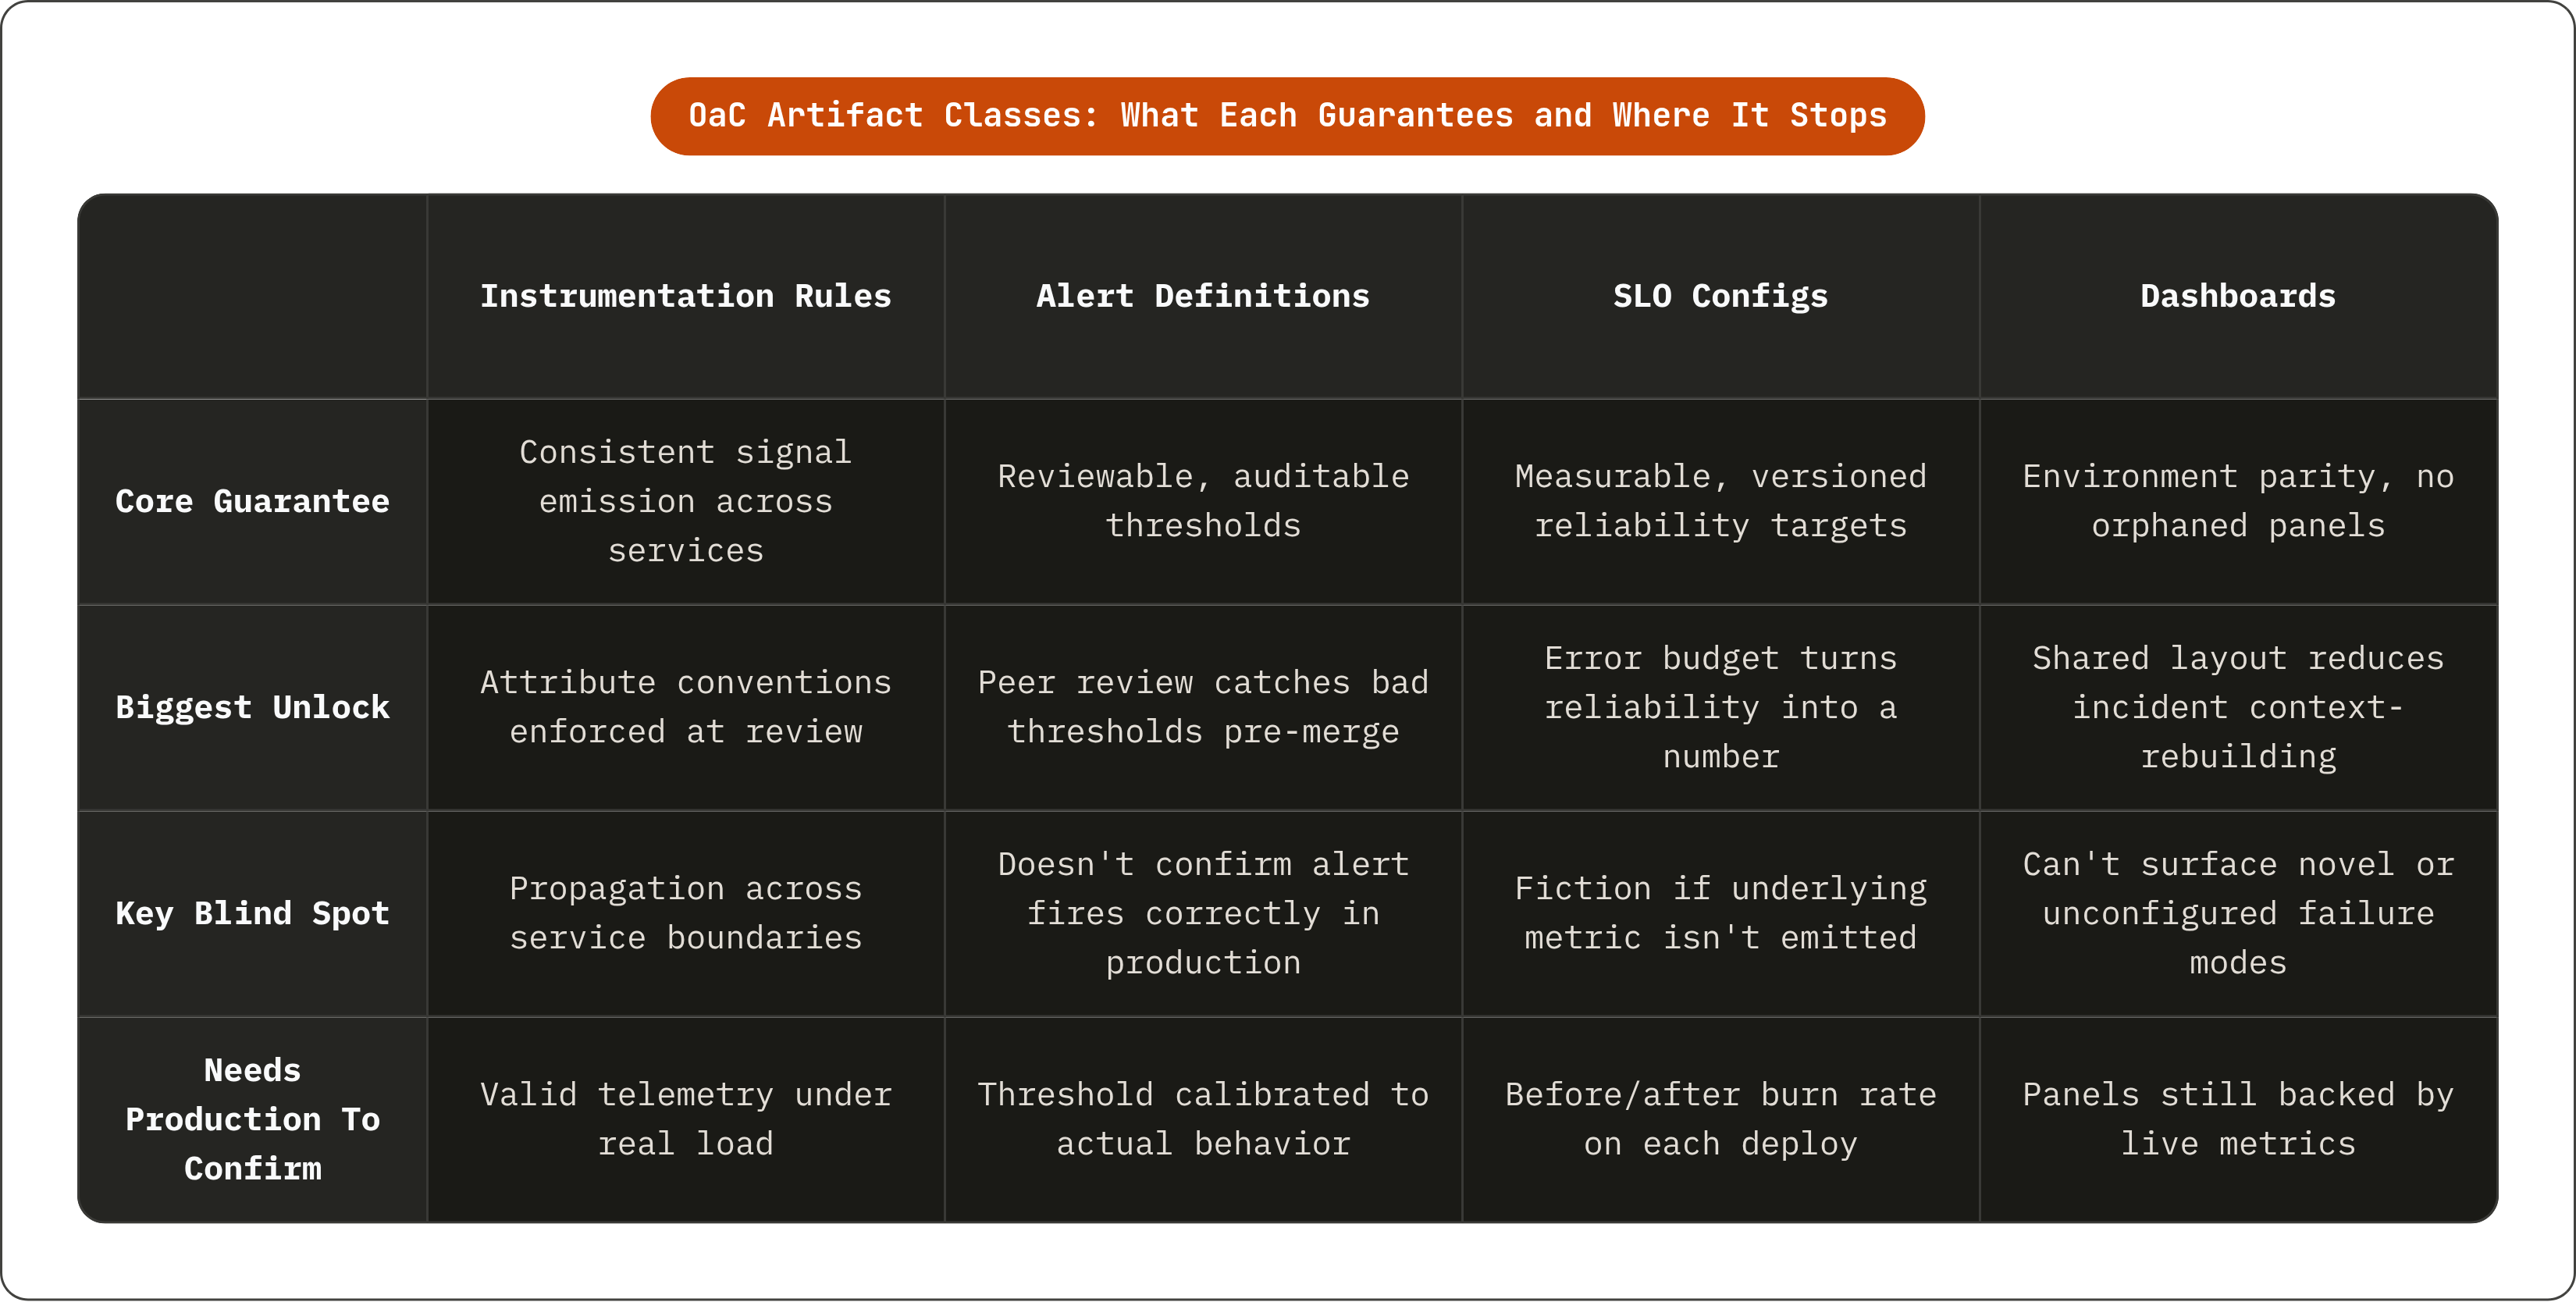
A working OaC system rests on four artifact classes. Instrumentation rules decide what telemetry gets emitted and from where, while alert definitions set the conditions, thresholds, and routing logic that turn telemetry into a page. SLO and error budget configs tie reliability targets to actual traffic instead of vibes, and dashboard definitions render all of it in a form a human can look at during an incident. None of this is new in concept; what's changed is that teams are finally versioning it.
OaC without discipline tends to look like this: monitors copy-pasted from one environment into another by hand, alert thresholds set at launch and never touched again, a dashboard that exists in staging because someone built it there once and never got around to production. The comparison to Infrastructure as Code is almost too easy, but it holds. IaC tools spin up servers consistently across environments; a server provisioned without a matching observability config is a blind spot, and it's a blind spot by design, not by accident. "As code" is the operative phrase because it buys you auditability, peer review, rollback, and environment parity, and that discipline is what separates a pile of dashboards from observability infrastructure. This piece is written for backend and platform engineers who own production reliability, not for the people who just consume the dashboards.
Why OaC exists: the production coverage gap that manual configuration leaves behind
A green CI pipeline tells you the code compiled, the tests passed, and the deploy succeeded, but it does not tell you the deployment actually works under production load. Production telemetry is the only ground truth that exists on that question, and manual observability configuration is a slow, reliable way to lose track of it.
Manual configuration produces three predictable failures. Environment drift shows up when staging accumulates monitors that production never got, because someone added them during a debugging session and forgot to port them over. Alert debt accumulates when thresholds set at launch stay frozen while traffic patterns, seasonal load, and system architecture all shift underneath them, and coverage blind spots appear when services added during a growth phase never get instrumented at all, because instrumentation was never part of the definition of "done."
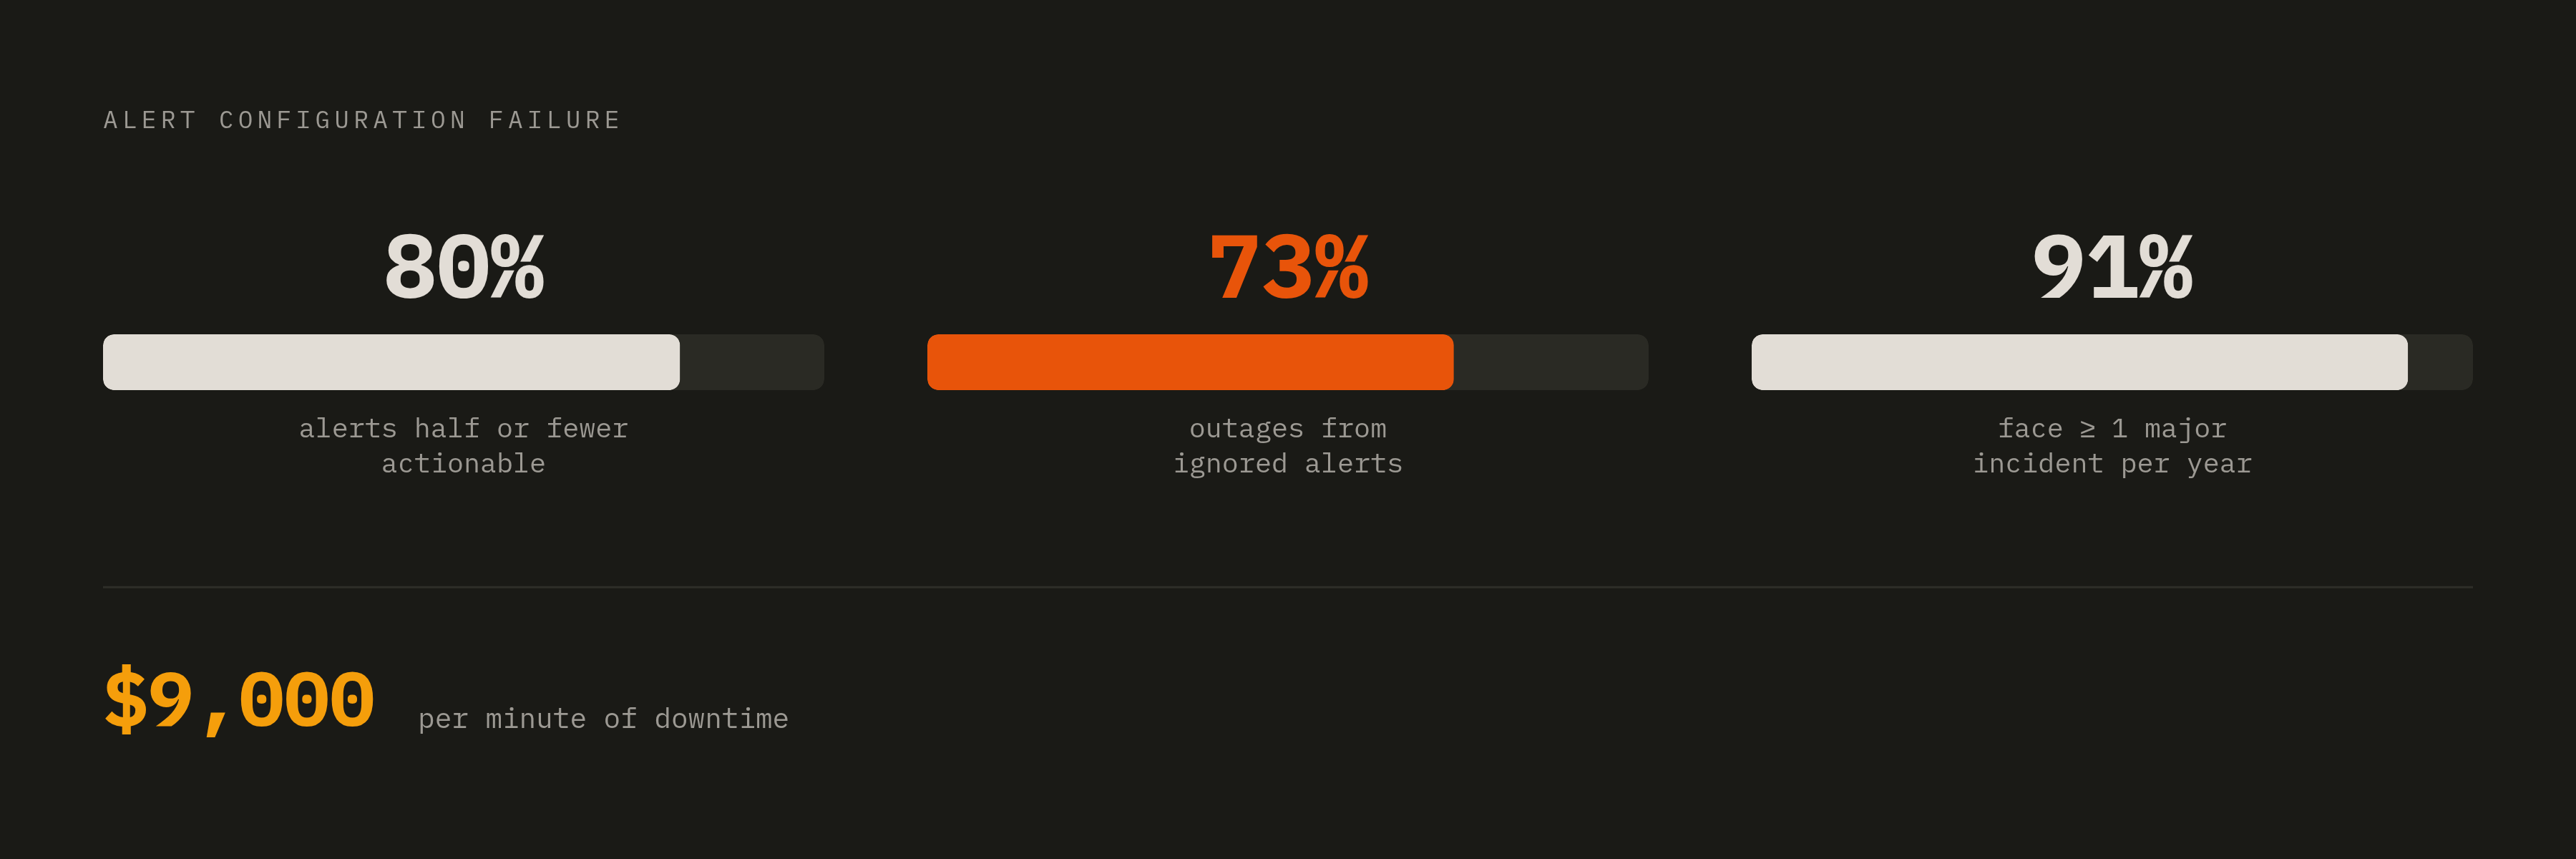
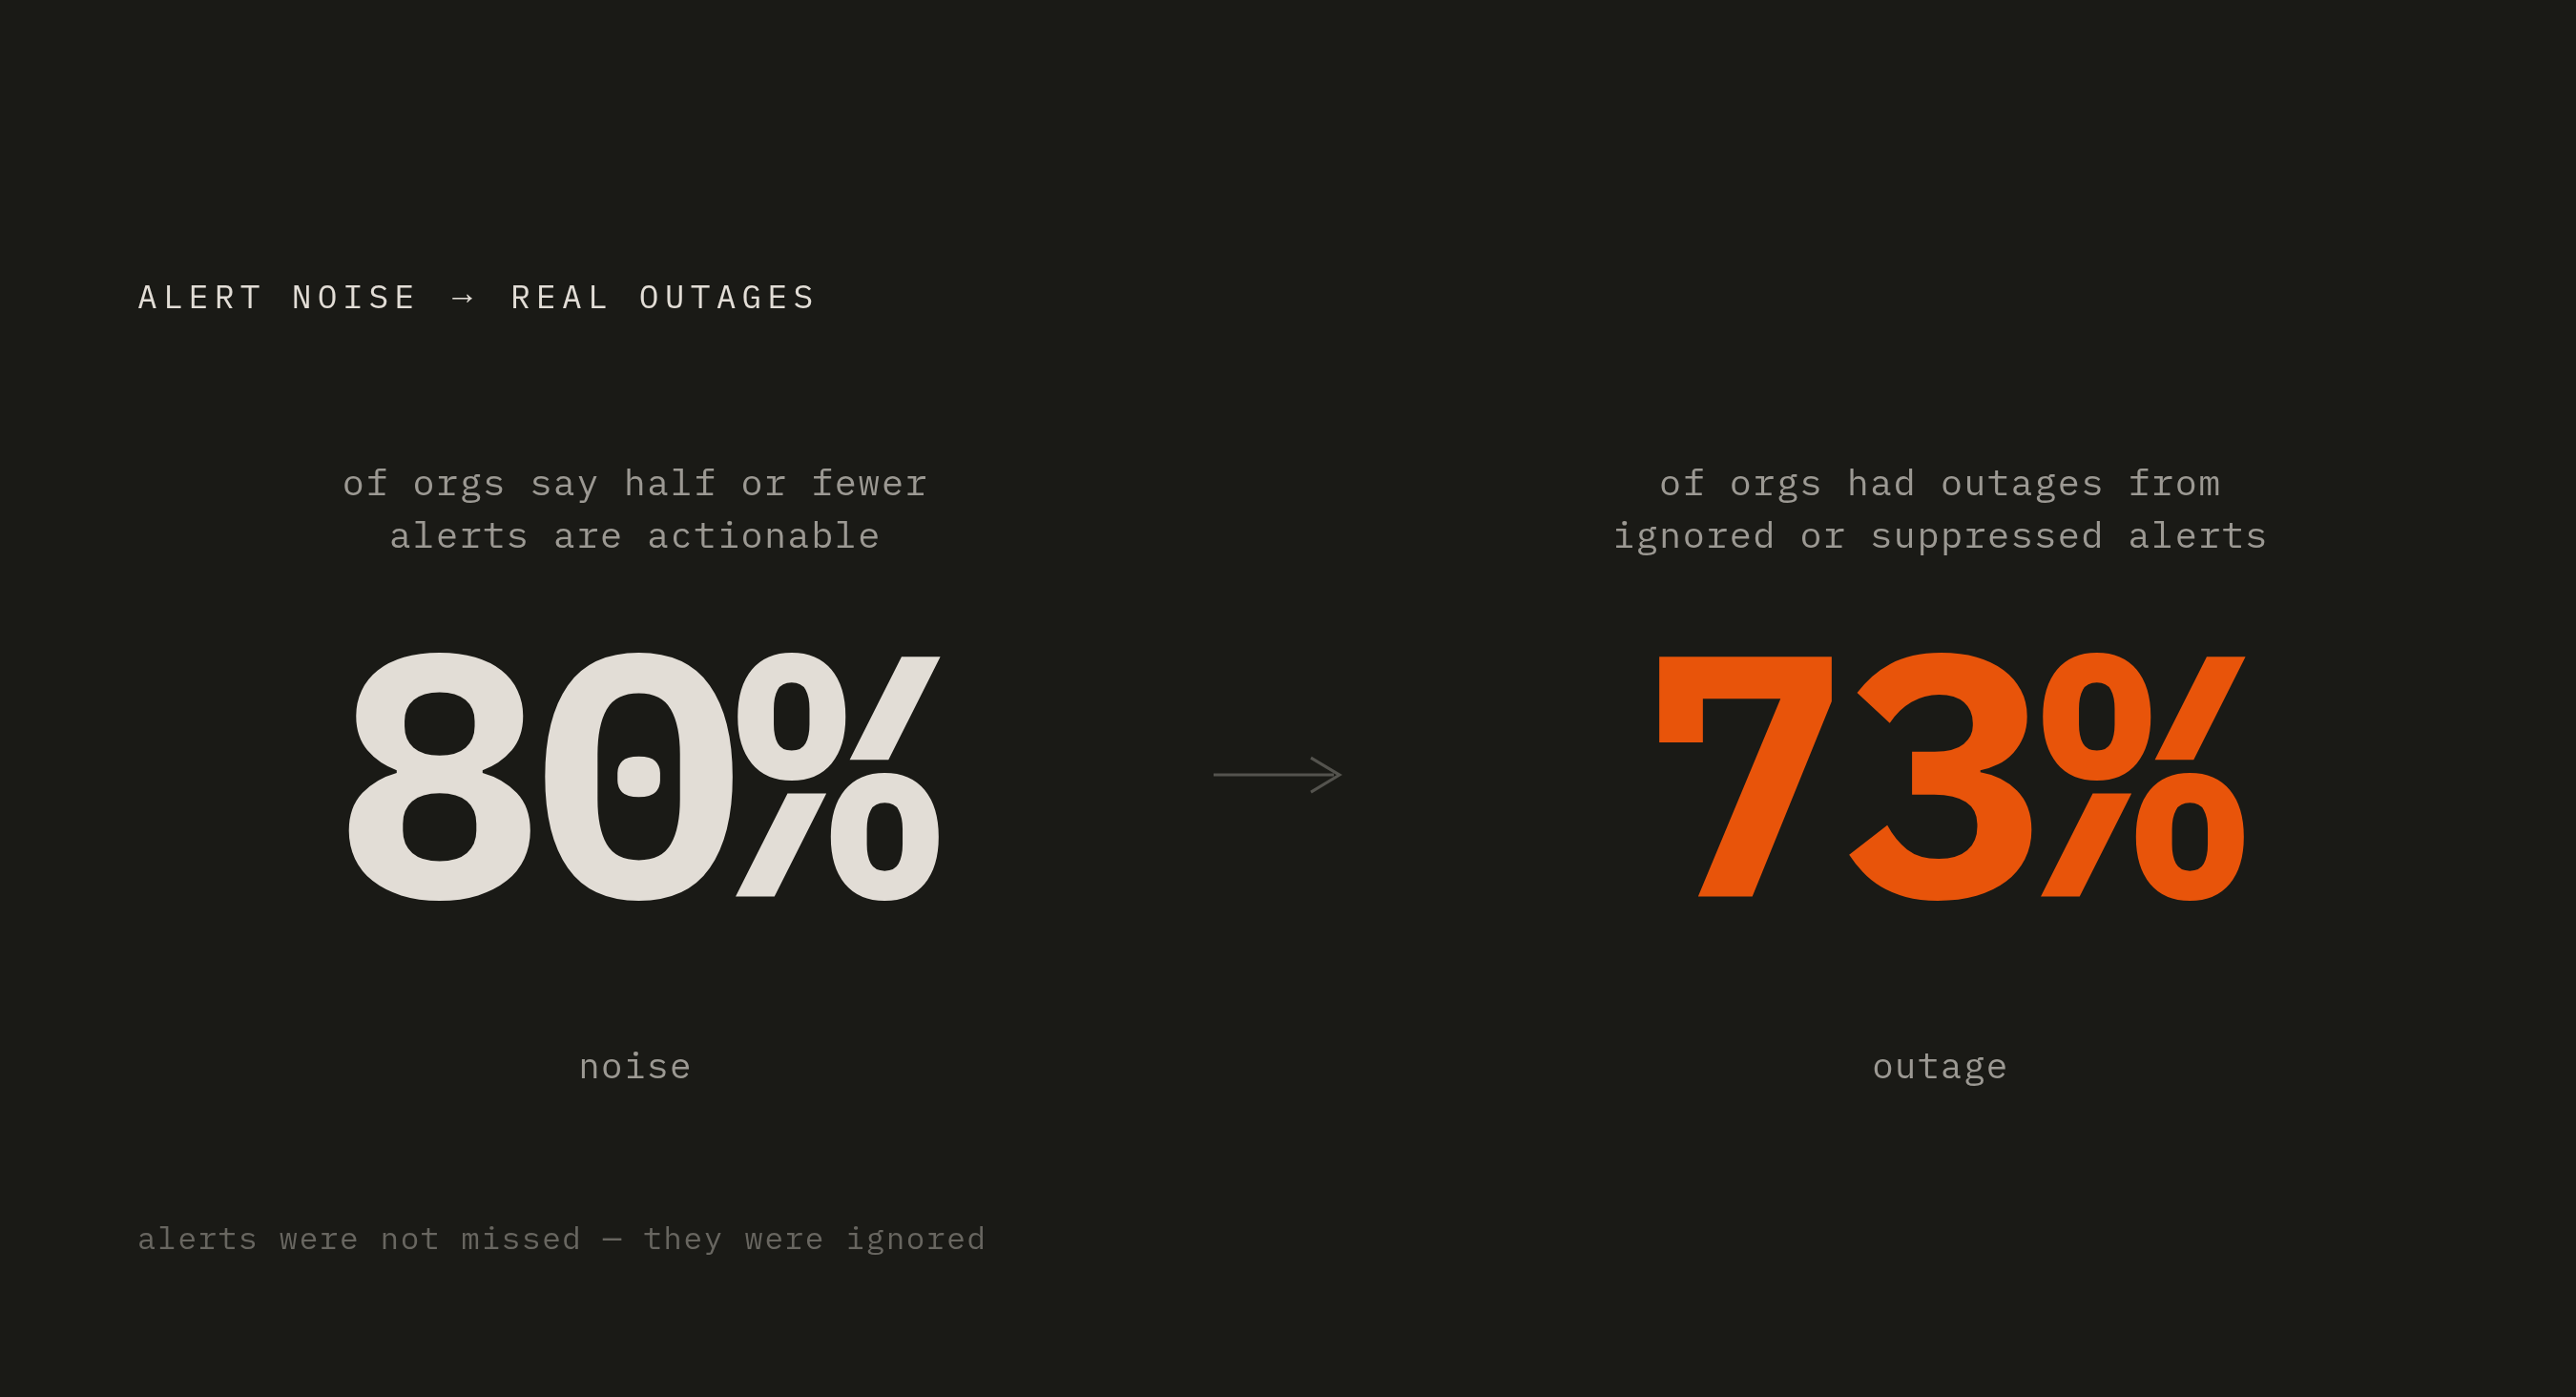
The downstream consequence is alert fatigue, and it's a well-documented one. Per NeuBird AI's 2026 State of Production Reliability report, 80% of organizations say half or fewer of their alerts are actually actionable, and seventy-three percent of organizations report outages caused by ignored or suppressed alerts. High noise volume trains people to dismiss notifications, the same way a car alarm that goes off every night stops meaning anything to the neighborhood, so this isn't a matter of engineers getting careless. The root cause sits in alert definition, which is a configuration problem, and configuration problems are exactly what OaC is built to address at the source.
The cost shows up as toil. Operational toil rose to 30% of engineering time in 2025, up from 25%, the first increase in five years, and seventy-eight percent of developers report spending at least 30% of their time on manual toil. Poorly defined observability configuration is a direct contributor to that number; every alert an engineer has to manually re-triage, every dashboard someone has to rebuild from memory, is toil that a version-controlled config would have prevented. The fix OaC offers is structural: when alert definitions, thresholds, and SLO configs live in git, they get reviewed, tested, and improved the same way application code does. "Set it and forget it" stops being a viable failure mode because someone's PR review will ask why the threshold hasn't changed in eighteen months.
Instrumentation rules as code: what they guarantee and where they stop short
Instrumentation rules as code standardize which signals get emitted, logs, metrics, traces, across every service in a system, and they enforce attribute conventions like service name, environment, and version so that telemetry is actually queryable when someone needs it at 2 AM. They also make instrumentation reviewable in a pull request, since a missing span or a log line without a trace ID gets caught by a reviewer before deploy instead of getting discovered during an outage.
Pre-merge instrumentation testing has become a real practice in 2025: validating that telemetry output is structurally valid before code ships, using local observability sandboxes that emulate production conditions closely enough to catch obvious gaps. This closes a lot of ground, though it does not close all of it.
Rules define what should get emitted, but they don't verify that downstream services actually receive and correlate the spans once they leave the process boundary. Missing propagation headers across service calls produce broken traces, and no rule definition will surface that until real traffic actually flows through the path. There's also a newer gap opening up around LLM-backed services: prompt-completion linkage and token-level tracing require instrumentation patterns that go beyond what standard observability tooling typically provides out of the box. Teams building on top of language models are, in effect, writing their own extensions to fill that hole.
Coverage, for instrumentation rules, means the rule produces telemetry that's queryable under the conditions that actually matter: high error rates, latency spikes, partial failures, the messy stuff, rather than merely existing somewhere in the repo. A rule that only proves itself during a clean happy-path test hasn't proven much. The practical starting point is to instrument at service boundaries first, ingress, egress, database calls, and expand inward from there, since rules applied without that hierarchy tend to produce telemetry volume that obscures more than it clarifies. More data is not the same as more signal.
There's a newer wrinkle worth naming directly. With 57% of organizations now running AI agents in production, and multi-agent architectures showing up in 72% of enterprise AI projects (up from 23% in 2024), instrumentation rules have to account for tool invocations, delegation handoffs between agents, and policy decision events, not just HTTP requests in and responses out. Without deliberate instrumentation, intermediate agent behaviors — retries, delegation handoffs, failed tool calls — can be invisible from the outside, so the rule has to be written to capture them explicitly, or it won't.
Alert definitions as code: writing thresholds that stay honest over time
The specific failure this pattern targets is the alert threshold set once at launch and never revisited, even as the traffic hitting the service changes shape entirely over the following two years. Defining alerts as code doesn't fix that automatically, but it makes the fix possible in a way manual configuration never allowed.
Peer review is the biggest unlock. A second engineer can look at a threshold in a PR and ask why it's 500ms and not p99 latency, a question that almost never gets asked when the threshold lives in a UI only one person ever opens. Environment-specific parameterization lets staging carry different thresholds than production without maintaining two separate, drifting configs, and git history becomes an actual audit trail: when an alert fires at 2 AM, the on-call engineer can see exactly when the threshold last changed, and read the PR description explaining why.
Four noise-reduction patterns become enforceable once alerts live in code instead of a dashboard. Thresholds get fine-tuned from historical data using statistical methods rather than intuition, and de-duplication and grouping get baked into the alert definition itself, instead of getting configured ad hoc inside whatever incident tool the team happens to use that quarter. Ownership gets assigned in the config, so the engineer responsible for a service is also the engineer responsible for that service's alert definitions, and suppression rules get versioned right alongside the alerts they govern, which matters more than it sounds like it should.
Over-suppression is the trap here. Aggressive noise reduction is genuinely useful until the moment it buries the one alert that mattered, and teams that tune suppression outside of version control usually don't notice until after the fact. Tuning it in code makes the tradeoff explicit and auditable instead of invisible.
None of this matters if the alert never gets tested against real traffic. An alert definition that looks airtight in review is still just a promise until it fires correctly on a real incident and stays quiet through everything that isn't one. At $9,000 per minute of downtime, and with 91% of companies facing at least one major incident per year, a misconfigured alert that causes missed or delayed detection is not an abstract inefficiency. It's a line item.
SLO configs as code: turning reliability targets into operational decisions
An SLO as code is a version-controlled definition of a reliability target: the SLI that measures it, the time window it's measured over, and the error budget burn rate that triggers action when things start going sideways. Eighty-six percent of organizations expect to have deployed AI initiatives by 2027, and many of them have yet to use SLOs as active operational inputs. OaC reframes them as active inputs into sprint prioritization, release gates, and incident escalation criteria, which is a meaningfully different use of the same number.
Writing an SLO config commits a team to something specific: a measurable definition of "working" for a given user-facing service, an error budget that turns the velocity-versus-reliability argument into a number instead of a political negotiation, and a burn rate alert that fires on trajectory rather than waiting for the threshold to actually get crossed. That last piece is what lets a team catch a problem before the SLO breaches, not after.
SLO configs earn their keep most clearly right after a deploy. Comparing error budget burn rate before and after a change is one of the most direct signals available for whether that change degraded reliability under real traffic, more direct than almost any other single metric a team tracks.
They fall apart, though, without the telemetry underneath them. An SLO defined against a metric that isn't actually being emitted is a fiction dressed up as a config file; the YAML is correct and the coverage is missing, and those are two very different things that look identical on a screen. SLOs that don't account for traffic volume also produce misleading budget math during low-traffic windows, when a handful of errors can look like a crisis purely because the denominator shrank.
Feature flags pair naturally with SLO configs. The SLO defines the threshold at which a rollout should stop; a flag is the runtime mechanism that actually stops it, without requiring a redeploy in the middle of an incident. And reviewing SLO configs in the PR process gives platform teams a genuine forcing function: a service without a defined SLO config fails the check. Coverage stops being an aspiration and becomes a merge requirement.
Dashboards as code: what they show and what they can't tell you
Dashboards as code means the dashboard definitions live in version control and deploy through the same CI/CD pipeline as everything else, parameterized by environment so the production view and the staging view come from one template instead of two hand-built ones that slowly diverge.
This solves a handful of specific, annoying problems. Drift between environments, where staging shows metrics production doesn't and vice versa, stops happening once there's one source of truth. Orphaned dashboards, the ones still pointing at a metric or a service that got deprecated long ago, become visible through the same review process that catches other stale artifacts: someone notices during review, or a validation step flags the broken reference. Dashboard proliferation, the pile of one-off, per-engineer dashboards that quietly hold institutional knowledge and vanish the day that engineer leaves the company, stops accumulating.
The value at incident time is real and easy to underrate. An on-call engineer dropped into an unfamiliar service should land on a dashboard built with the same panel structure and layout logic as every other service's dashboard, so they're not reconstructing context from scratch while a page is actively firing.
Here's the ceiling, though, and it's a hard one. Dashboards visualize signals someone defined in advance, but they do not surface causal relationships, novel failure modes, or cross-service correlations that nobody thought to wire up at build time. A dashboard is a hypothesis about what will matter, frozen at the moment someone wrote the panel; reality doesn't always cooperate with that hypothesis.
Tool sprawl makes this worse during an actual outage. Every extra tab an engineer has to open, a separate dashboard tool here, a separate log viewer there, a separate trace explorer somewhere else, is time the SLO is burning while nobody's looking at the actual problem. Dashboards as code should consolidate that surface area, not add to it. And the review process itself is worth more than it usually gets credit for: a dashboard PR is a cheap moment to ask what would actually tell the team this service is unhealthy, a question that surfaces coverage gaps before production asks it the hard way.
Integrating OaC patterns into CI/CD without adding gates that slow delivery
The integration principle is straightforward: OaC artifacts should travel with the service code that generates their telemetry. Same repo, same PR, same review cycle. An instrumentation rule that lives in a different repo than the service it instruments will drift from that service within a quarter, guaranteed.
At each pipeline stage, the work looks a little different. Pre-merge, the job is linting and validating instrumentation rule schemas, checking that SLO configs actually reference metrics that exist in the instrumentation layer, and running dashboard definitions through a schema validator. At deploy time, alert and SLO configs apply alongside the infrastructure changes, not as a manual step someone remembers to do afterward if they remember at all. Post-deploy, the pipeline needs to verify telemetry is actually flowing in production, because a green deploy confirms the config got applied, not that it's producing data.
Teams don't need a full platform migration to start. Terraform handles alert and dashboard provisioning reasonably well already, and Crossplane, paired with the Upjet project, gives teams a Kubernetes-native path into OaC. OpenTelemetry collector configs work as the instrumentation layer underneath all of it. Adoption can happen one artifact class at a time.
There's real pressure building here, too. AI-generated code is shipping at a pace that compresses the window between a PR merging and production traffic actually hitting the new code, and OaC pipeline integration is what keeps observability configuration from lagging behind that deployment frequency. Shift-left, in this context, means automating the validation of observability configs so nobody has to think about whether they're correct in the middle of an incident, because that question already got answered before merge.
One gap doesn't close through pipeline integration alone, though, and it's worth being blunt about it. Applying configs through CI/CD confirms the deployment happened, but it does not confirm coverage. A separate post-deploy verification step, checked against real production telemetry, is the only thing that confirms the OaC pipeline actually delivered what it promised.
What OaC can't verify without production telemetry in the loop
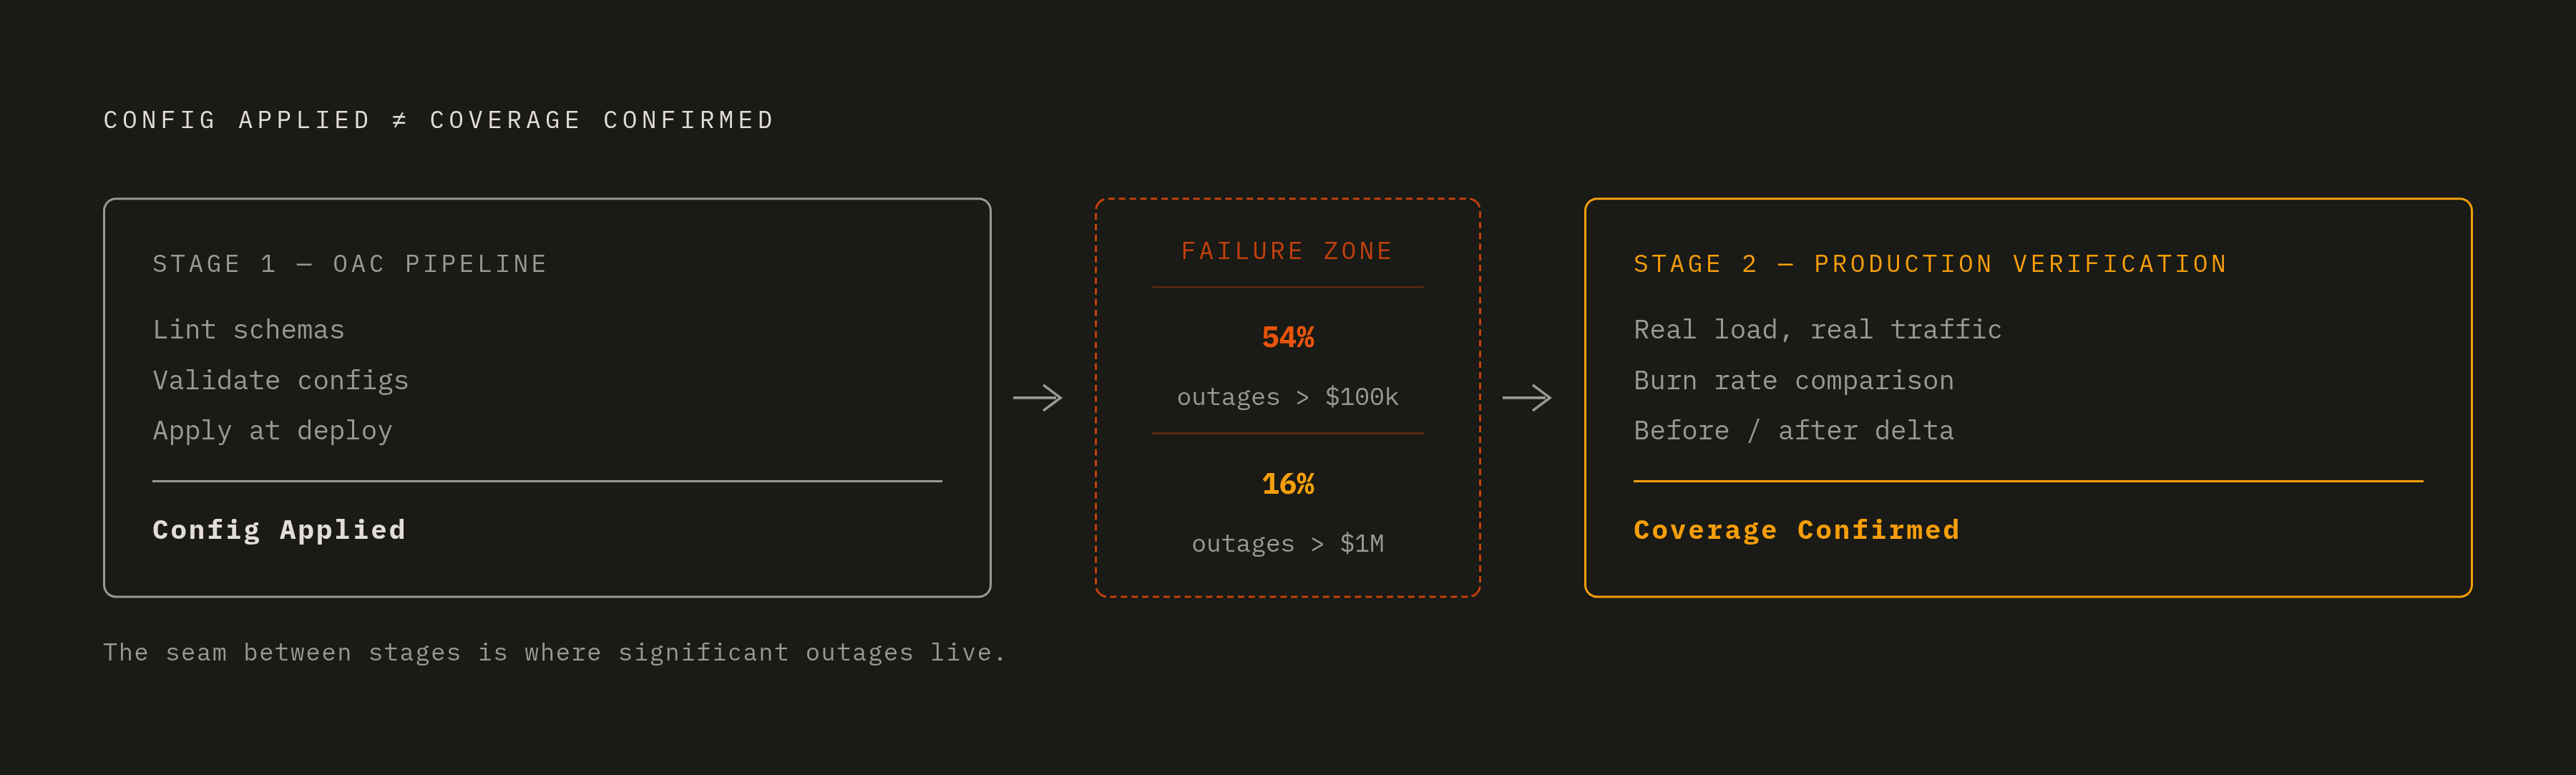
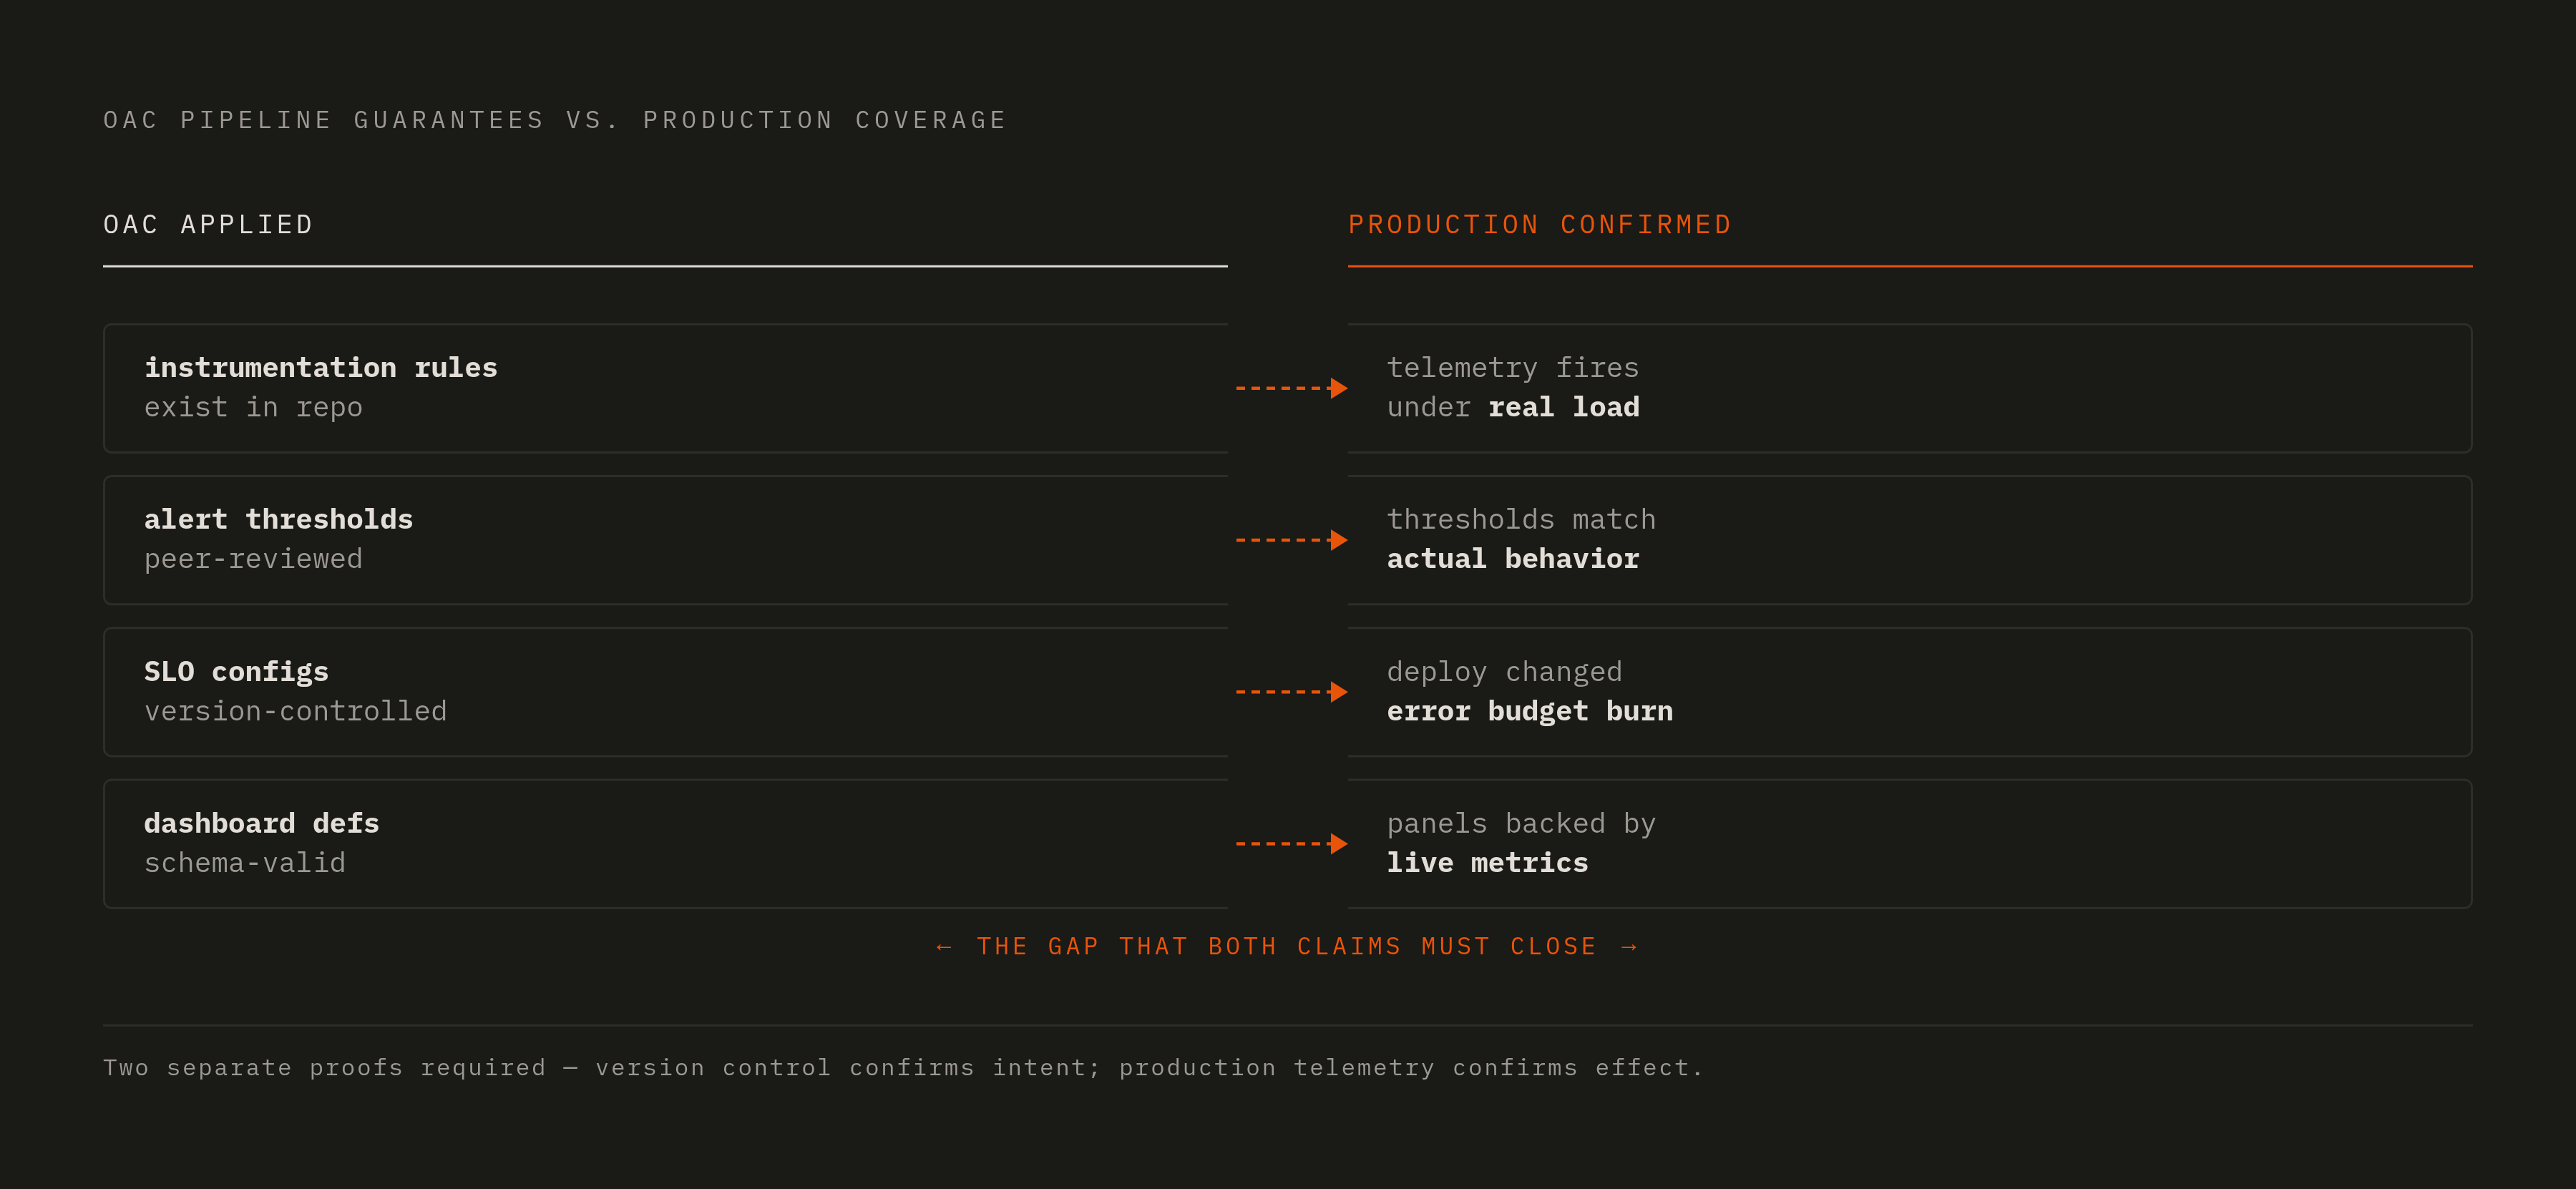
Here's the distinction that matters most in this entire discussion: OaC defines and versions what telemetry should exist. Production verification confirms that telemetry actually exists, is accurate, and fires under the conditions that matter. Those are two different jobs, and conflating them is where a lot of teams get burned.
Four things a version-controlled OaC config genuinely cannot tell you, no matter how carefully it's written. Whether instrumentation rules are producing valid telemetry under real load, as opposed to just emitting cleanly at startup and then going quiet under pressure. Whether alert thresholds that looked well-reasoned in review are actually calibrated to how the service behaves in production. Whether a specific deploy changed the error budget burn rate; that requires an actual before-and-after comparison against real traffic, not a static review of the config. And whether a dashboard panel is still backed by a metric that survived the last service refactor, or whether it's quietly rendering nothing.
The pressure here is only increasing as AI writes more of the code. Sixty-nine percent of AI-powered decisions still require human verification, and quality is cited as the top barrier to production deployment by 32% of teams. That argues for more automated post-deploy verification against real telemetry, precisely when AI is generating a growing share of what ships. DORA's 2025 research found AI adoption positively related to throughput and negatively related to software delivery stability, a finding worth sitting with for a moment rather than rushing past. Shipping faster with a well-built OaC setup and no post-deploy verification closes exactly none of that stability gap; it just means the gap opens at a higher velocity.
The cost of getting this wrong is not theoretical. Fifty-four percent of significant outages cost over $100,000, and 16% exceed $1 million. That asymmetry is the whole argument for treating "OaC applied" and "production coverage confirmed" as two separate claims that both need proving. What closes the gap is automated post-deploy verification, comparing production telemetry against expected baselines after every deploy, treating each deployment as a verification event rather than just a delivery event. That's the exact seam OnePatch sits in: the space between a merged PR and the production signal that either confirms it worked or tells you, quickly, that it didn't.
Building OaC toward production-verified telemetry coverage, not just config parity
Config parity across environments is a real achievement and worth having, but it is not the finish line. A team can reach perfect parity, every instrumentation rule, alert definition, SLO config, and dashboard identical across staging and production, and still discover during an outage that half of it never fired correctly against real traffic.
The mature version of OaC treats every artifact class as a claim that needs verifying against production telemetry, even after it passes review. Instrumentation rules need production-load validation, not just startup checks, and alert definitions need to prove themselves against real incidents over time, quietly earning trust or getting rewritten. SLO configs need the before-and-after burn rate comparison on every deploy, not a quarterly glance, and dashboards need someone checking, periodically, that the metrics behind the panels are still alive.
None of this is a knock on OaC itself. Version-controlled observability configuration is a genuine improvement over the manual, drift-prone alternative it replaced, and every pattern covered here is worth building. The honest addition is a verification layer that sits after the pipeline, checking what actually happened in production against what the config promised would happen. One Patch is built to occupy exactly that layer, an AI agent that automatically verifies every PR against live production telemetry after it deploys, investigates regressions when something breaks, and opens fix PRs for human review. That's the step that turns config parity into something closer to the truth: telemetry coverage a team can trust, because someone checked, every time, rather than assumed.