Canary Deployments and Production Verification Gaps
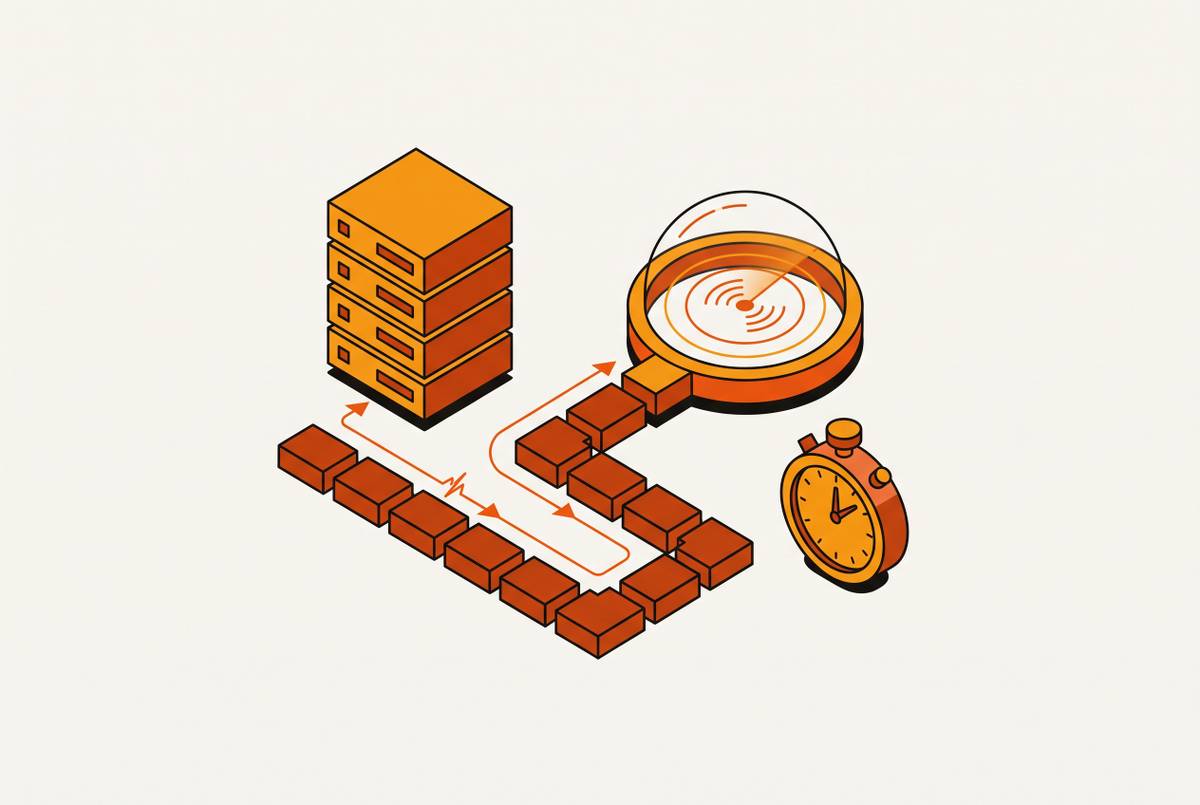
Canary deployments limit blast radius but don't verify health.
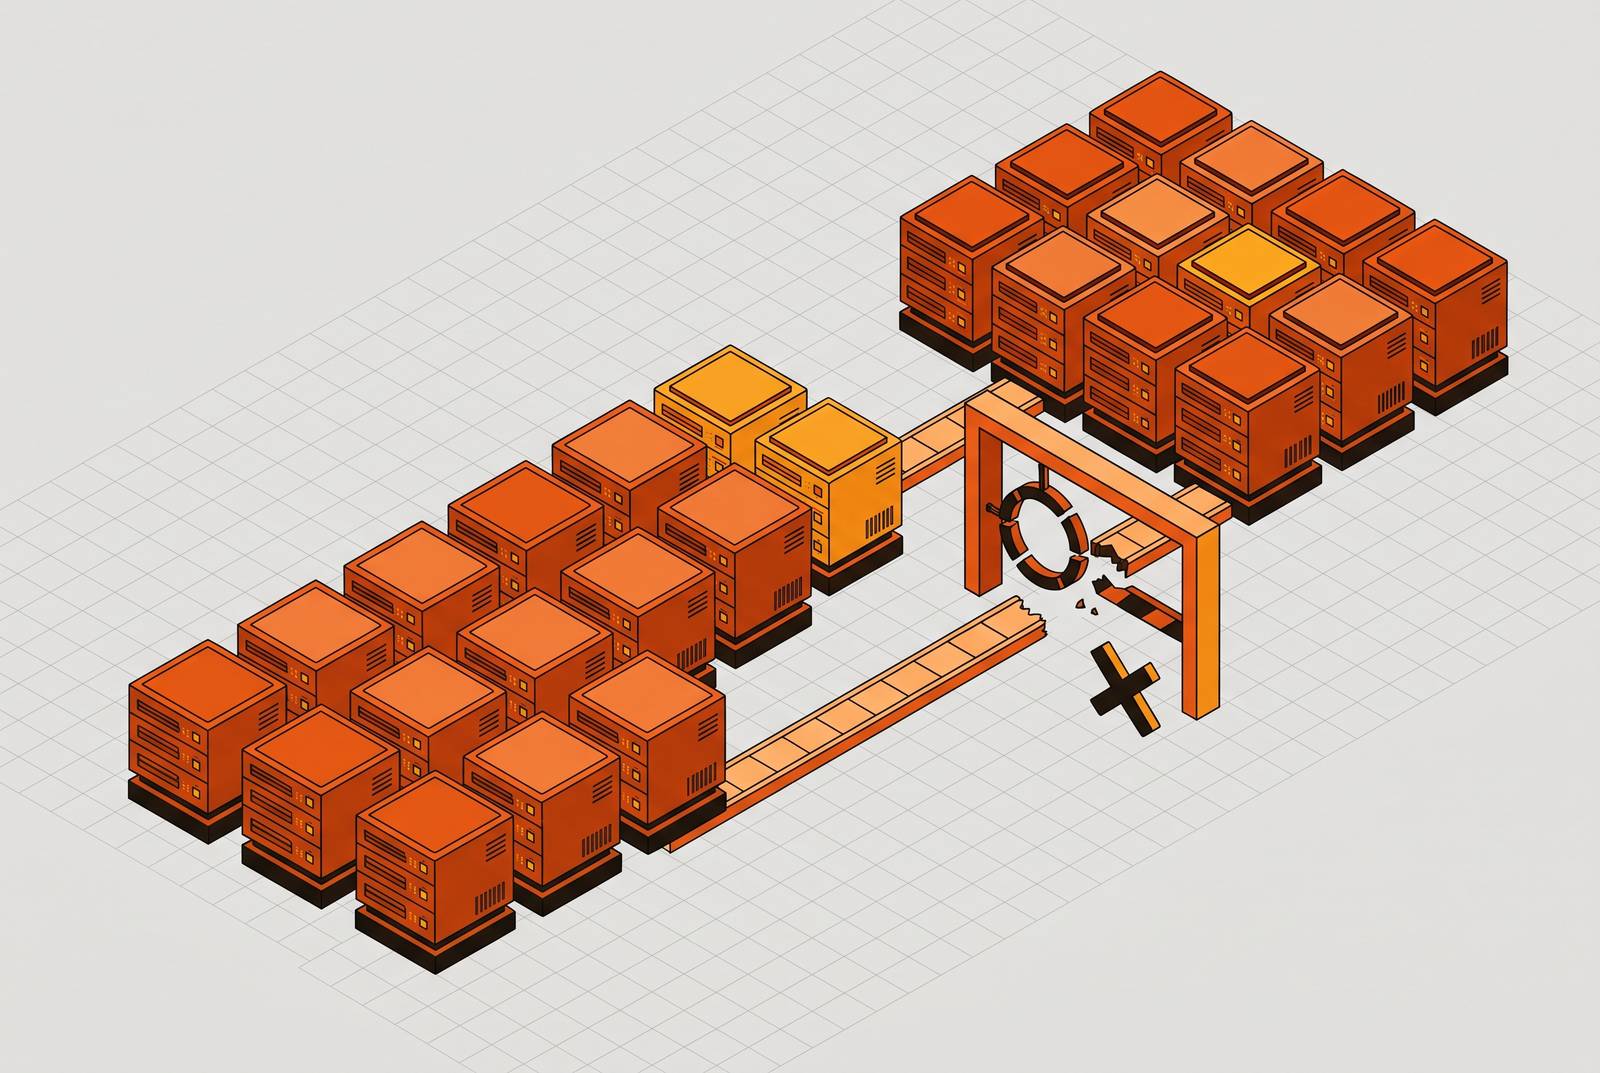
Canary deployments reduce blast radius. They do not reduce risk, and most rollout strategies fail exactly where those two ideas get treated as one. Splitting traffic between a stable release and a new one limits how many users see a bad build, but it doesn't confirm the build is healthy, and it doesn't catch failures that only surface once the whole fleet has switched over. The real incident risk lives in the gap between routing traffic to a canary and actually verifying it with production telemetry, and that gap opens long before any dashboard trends the wrong way.
A canary proves a release survives at partial traffic. That's the whole claim, and teams routinely ask it to carry more weight than it can hold. It doesn't prove the release is healthy, doesn't prove it holds once the full user base lands on it, and doesn't prove problems haven't already started accumulating upstream. Routing traffic to a canary and verifying that canary are two separate acts. Most engineering teams treat the first as evidence of the second, and that substitution is the mistake worth naming plainly: it's the single most common failure mode in progressive delivery today.
Short canary windows make the substitution worse, not better, whatever teams tell themselves about moving fast. A canary promoted after a few minutes may never surface a gradual memory leak, a state migration mismatch, or a failure mode that only appears under load. Some problems don't exist yet at 5% traffic. They wait for the other 95%, and a team that promotes early has no way of knowing that's what just happened.
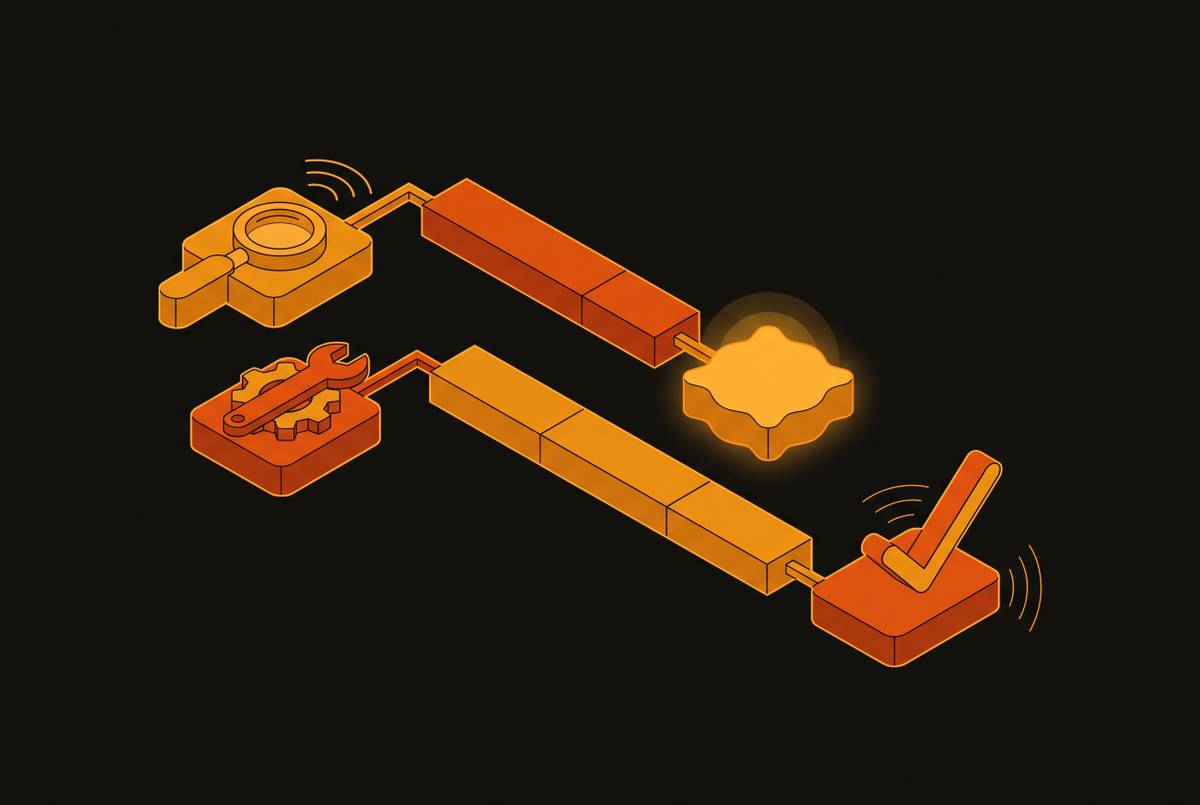
A structural window always sits between traffic flowing to the canary and someone confirming, via telemetry, that the canary is actually fine. Teams that treat that window as a formality watch the strategy break quietly, usually without anyone noticing until the postmortem.
The four structural gaps canary traffic splitting leaves open
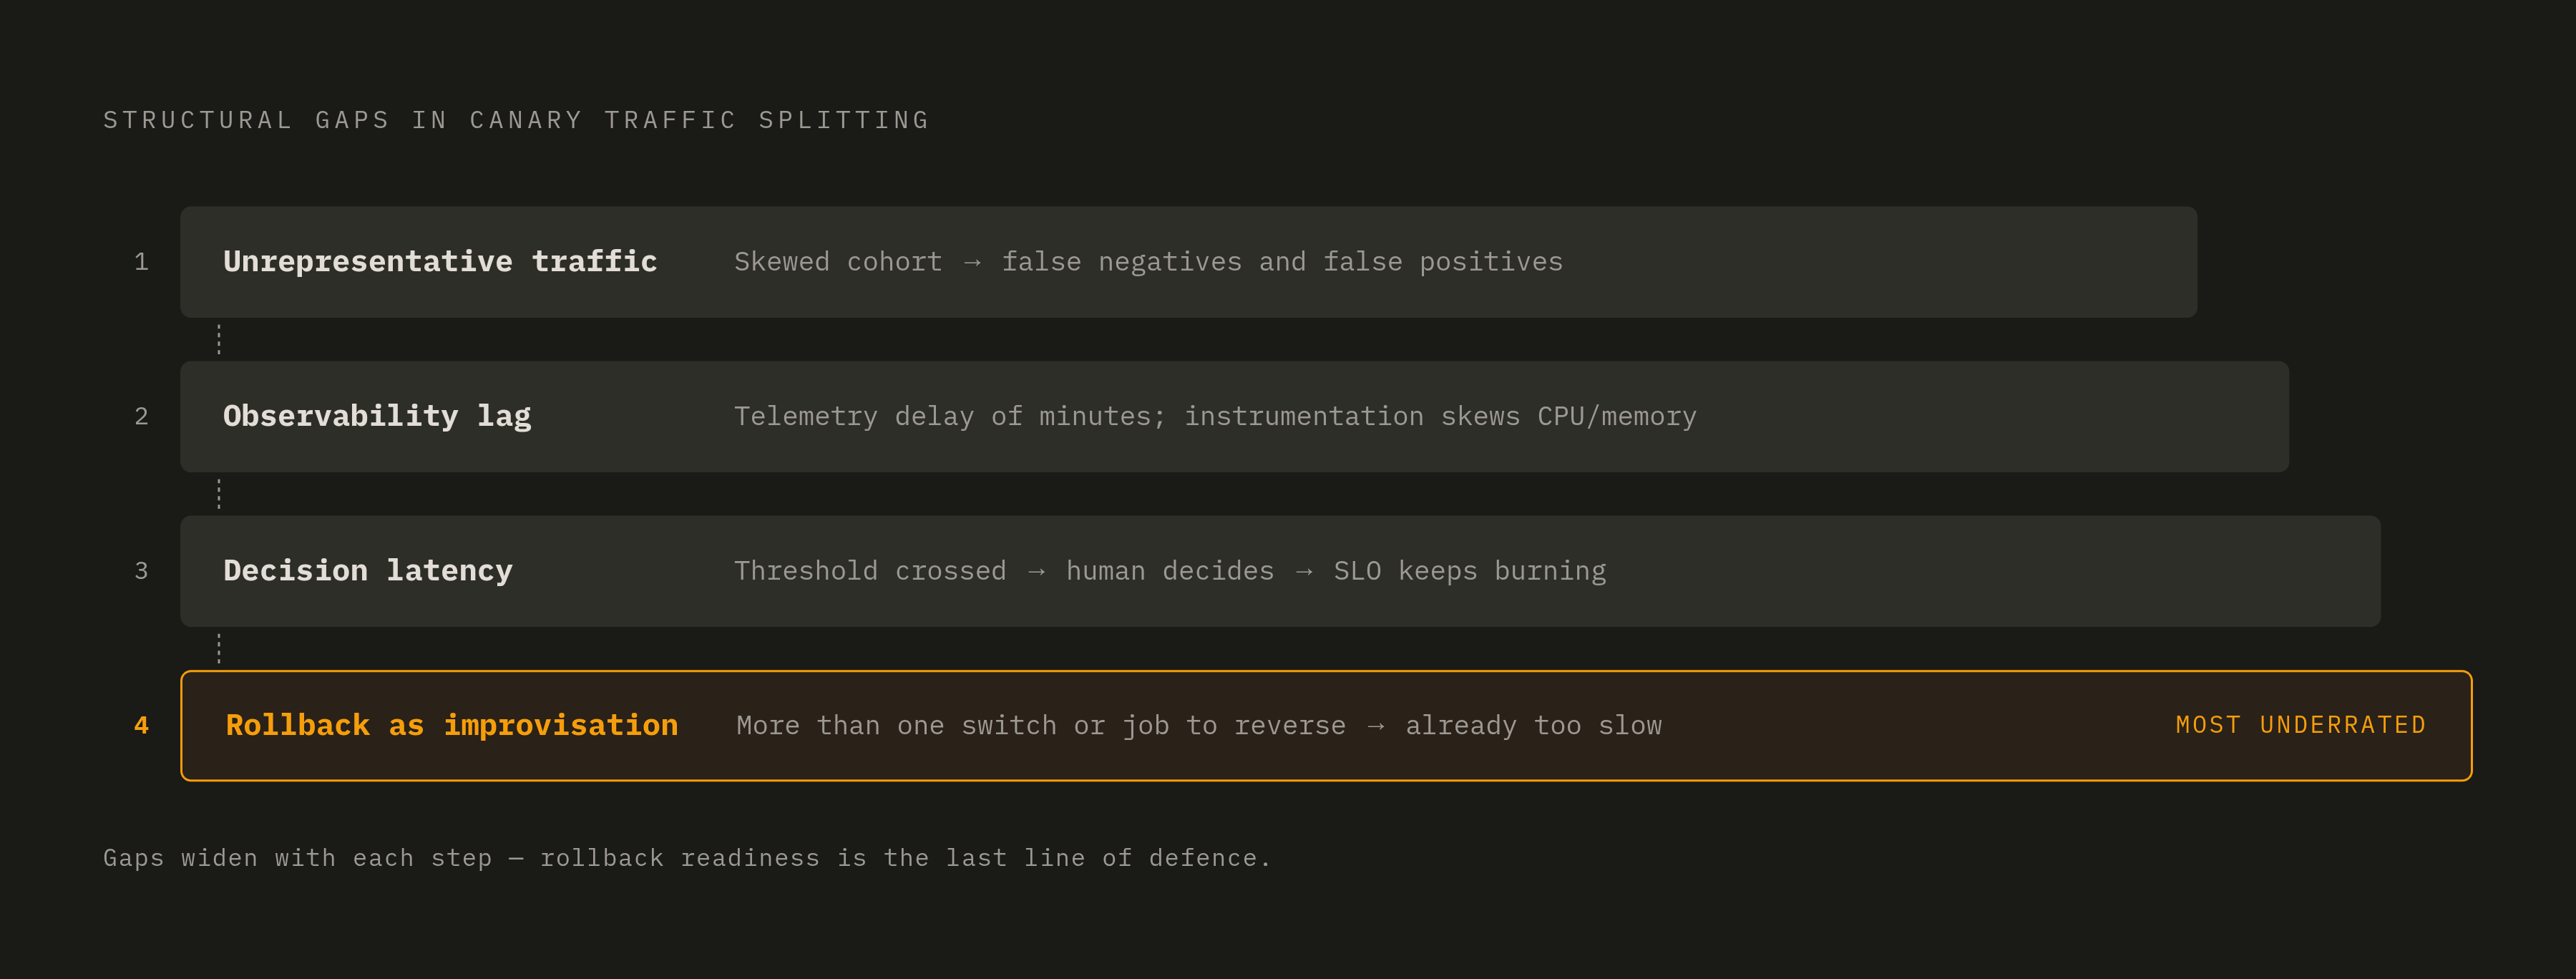
Four gaps show up again and again, and adopting progressive delivery doesn't make any of them disappear on its own.
The first is unrepresentative traffic. A small slice of live traffic can skew toward one geography, one user cohort, one kind of request, and miss the exact path that triggers the failure. That produces false negatives, where the canary looks fine because the problem workload hasn't arrived yet, and false positives, where the canary looks degraded because it happened to catch an odd traffic spike that had nothing to do with the release.
The second is observability lag. Telemetry pipelines introduce delay, sometimes minutes, before metrics reflect what's actually happening on the canary. Worse, the extra instrumentation running on the canary instance can itself skew CPU and memory numbers, confounding the very signal it's supposed to produce. None of this works without a clean baseline, and that baseline has to exist before the canary opens, not get assembled afterward while the window is already burning.
The third is decision latency. The time between a metric crossing a threshold and a human deciding to roll back is never zero, and the SLO burns for as long as that gap stays open. Static thresholds, alert when a metric exceeds some fixed value, generate noise on ordinary traffic spikes and miss the slow regressions that never cross the line cleanly. Manual promotion decisions depend on someone watching a screen, and on-call engineers are not always watching the screen.
The fourth is the one teams underrate most: rollback treated as improvisation instead of a paved path. If reversing a bad release takes more than flipping one switch or running one pipeline job, it's already too slow for a live incident. Teams that treat rollback as a bespoke response, invented fresh each time something breaks, learn this the hard way, usually while the improvised fix introduces a second problem on top of the first. Schema migrations and other non-backward-compatible state changes make this worse. Past a certain point, rollback isn't slow. It's structurally impossible, and canary window sizing has to account for that directly, not as an afterthought bolted on after the first bad migration.
Why instrumentation has to come before the canary, not alongside it
None of the four gaps close without telemetry that existed before the rollout started. Without a clean baseline, there's no way to say a canary is healthy or degraded. There's just a number with nothing to compare it against, and a number with nothing to compare it against isn't a signal. It's noise wearing a signal's clothes.
Proper instrumentation tracks error rates and latency at the service boundary, not only at the load balancer. It watches business metrics, conversion rate, transaction success, queue depth, alongside CPU and memory, because a canary that passes every infrastructure check can still be quietly wrecking the numbers that actually matter to the business. It also runs synthetic checks that exercise known critical paths on purpose, rather than hoping real traffic happens to hit them during the window.
The most common instrumentation failure is mundane and easy to miss. A new service gets added to the call chain using a plain HTTP client instead of the instrumented one, and the trace breaks silently. Instead of one end-to-end view of a request, there are two disconnected fragments, and nobody notices until someone is trying to root-cause an incident and the trace just stops, dead, at the exact boundary that matters.
OpenTelemetry has become the standard answer to that propagation problem, largely because it's vendor-agnostic. Switching observability backends doesn't require rewriting instrumentation across every service. Before OTel, vendor-specific propagation headers meant introducing a different backend for even one service in the chain could break trace continuity right at that boundary, a quiet form of lock-in nobody signed up for. Auto-instrumentation agents for frameworks like Spring Boot, Express.js, and Django now cover a large share of services with minimal setup, though manual instrumentation is still required for business logic and custom spans.
Tools like Flagger and Argo Rollouts automate canary analysis on top of Kubernetes infrastructure. Automation only helps if the telemetry underneath it is clean, though. Feed a good tool bad data, and it makes a bad call with total confidence, which is worse than making no call at all, because nobody thinks to double-check a decision the tool made so cleanly.
What production telemetry actually needs to answer during a canary window
Every canary window is really asking one question: is this version safe to promote, or should it roll back right now? Telemetry has to make that answer unambiguous, not a judgment call, and not a "let's watch it a bit longer."
Three kinds of signal answer three different questions, and none of them substitutes for the others. Metrics ask what's happening, SLO health, throughput, error rate trends, and they're the gate signal for automated promotion because the volume is low and the picture is stable. Traces ask where it's happening, which service in the dependency chain is the bottleneck, essential for root-causing a degradation fast enough to actually act on it. Logs ask what exactly happened: event-level detail on a specific failing request, high in volume and usually queried only after metrics or traces have already flagged a problem.
Treat these as layers, not competing options. A team gating promotion on error rate alone misses a latency regression building underneath it, and a team leaning only on logs misses the trend entirely, because nobody stares at a stream of individual log lines waiting to notice a pattern.
The promotion and rollback logic needs to be written down before the canary starts, not negotiated in the middle of one. If error rate crosses a defined line, the system rolls back without waiting for a human to notice it. If the canary holds across every signal for the full window, it promotes. Automated gates aren't a nice-to-have at that point. They're the only verification that runs consistently enough to matter.
How alert noise during a canary window undermines the whole strategy
None of this works if the real signal is buried under noise, and for a lot of on-call teams, it is. Industry research has consistently found that on-call stress contributes to burnout and attrition among SREs, with alert volume named as a primary driver.
Static thresholds are the structural root of the problem, and they deserve the blame more than any individual engineer's inbox habits. "Alert when CPU exceeds 80%" fires constantly on normal traffic spikes, trains engineers to treat alerts as background noise, and still misses the slow regression that never crosses the line cleanly. So when a canary window opens into an already-noisy alert environment, the real degradation signal shows up alongside dozens of unrelated pages. The on-call engineer triages the noise first, because that's what triage means, and reaches the actual canary signal late. Decision latency stretches, more users sit on the degraded version longer than they should, and rollback happens after the damage is already done.
Cutting that noise is a tooling fix, not a discipline fix, and teams that mistake one for the other keep losing engineers over it. An engineer who misses a real signal buried under hundreds of false alarms a day isn't undisciplined; the instrument made signal and noise indistinguishable, and no amount of vigilance fixes that from the outside. Telling engineers to "pay closer attention" treats a measurement problem as a character problem, and it will keep failing for exactly that reason.
Kubernetes-native canary tooling and where it still leaves teams exposed
Kubernetes gives teams a native way to run a canary without extra infrastructure: two Deployments, stable and canary, sharing one Service selector, with traffic split following the pod ratio. Nine stable replicas and one canary replica produce roughly a 90/10 split. It works with any cluster and costs nothing extra to set up.
It also can't be controlled granularly, and it has no built-in way to gate promotion or rollback on a metric. It splits traffic. It doesn't watch anything, and teams that stop there are one bad deploy away from finding that out the hard way.
Flagger, built by Weaveworks, goes further: it automates canary analysis through conformance tests, metric checks, and webhooks, and promotes or rolls back based on criteria a team defines up front. It works across a wide set of service meshes and ingress controllers, including Istio, Linkerd, Kuma, Contour, Gloo, Nginx, Skipper, Traefik, and Knative (App Mesh and Open Service Mesh have since been dropped from its supported provider list). Argo Rollouts covers similar ground as a Kubernetes-native progressive delivery controller, supporting canary and blue-green strategies with analysis runs that integrate against metric providers to gate each step.
Both tools share the same dependency, though: the analysis is only as good as the metrics feeding it. Neither can invent a clean baseline that doesn't exist, and neither can guarantee the traffic slice it's watching actually exercises the failure path in question. There's movement on the research side toward catching problems earlier still. Dell's US Patent 12,423,187 B1, granted in September 2025, addresses detecting configuration issues in microservices architectures before the canary window even opens, which suggests the industry already sees the current model, catch problems during the window, as insufficient on its own.
And once a canary is promoted to 100% traffic, most of this tooling is no longer actively gating the release. That's exactly the moment load-dependent regressions tend to surface, the ones that never appeared at 5% or 10% traffic because there wasn't enough load to trigger them. The tool did its job and walked away right before the failure mode it couldn't catch showed up.
Closing the gap: what deliberate production verification adds to a canary strategy
Merging a pull request and verifying it in production are two different acts, and canary traffic splitting only ever handled the first half. It manages exposure. It doesn't keep verifying a release after each promotion step, and it goes quiet exactly when full-load regressions are most likely to appear, which makes it a partial answer to a question that deserves a complete one.
Deliberate production verification fills that gap by comparing live telemetry against the pre-deploy baseline automatically, not a human eyeballing a chart and hoping it looks right, but a system that already knows what healthy looked like before the canary opened. That comparison has to run continuously across the entire window, not just at the moment someone decides whether to promote, and it has to keep running after the canary hits 100% traffic, since that's precisely where load-dependent problems hide, and services like One Patch, an AI agent that checks every deployed PR against live production telemetry and opens fix PRs automatically when regressions are confirmed, are built specifically to cover that post-promotion tail. When a regression is confirmed, the right response is a fix PR opened automatically and reviewed like any other change, not a war-room thread assembled at 2 a.m.
OnePatch sits in that exact spot, between pull requests and live production. It verifies every PR against real telemetry after it deploys, flags regressions before a human has to get paged at all, and opens fix PRs on its own when something breaks. That's the layer that actually closes the canary verification window, rather than just narrowing how many users get exposed to whatever falls through it.
Tool sprawl compounds the problem this is meant to solve. Every extra tab an engineer opens during a canary incident, one for metrics, one for traces, one for logs, one more for deployment status, is time the SLO keeps burning while someone hunts across four screens for the same answer. Putting that signal in one place changes the on-call experience in a way that's easy to underrate until the alternative has cost someone a weekend. The economics matter too: a vendor charging per incident resolved, rather than per seat, has an incentive that actually points at closing the verification gap, not just selling more licenses to watch it stay open.