What MTBF Measures in Software Reliability Engineering
Knowing what MTBF leaves out matters more than the number itself.
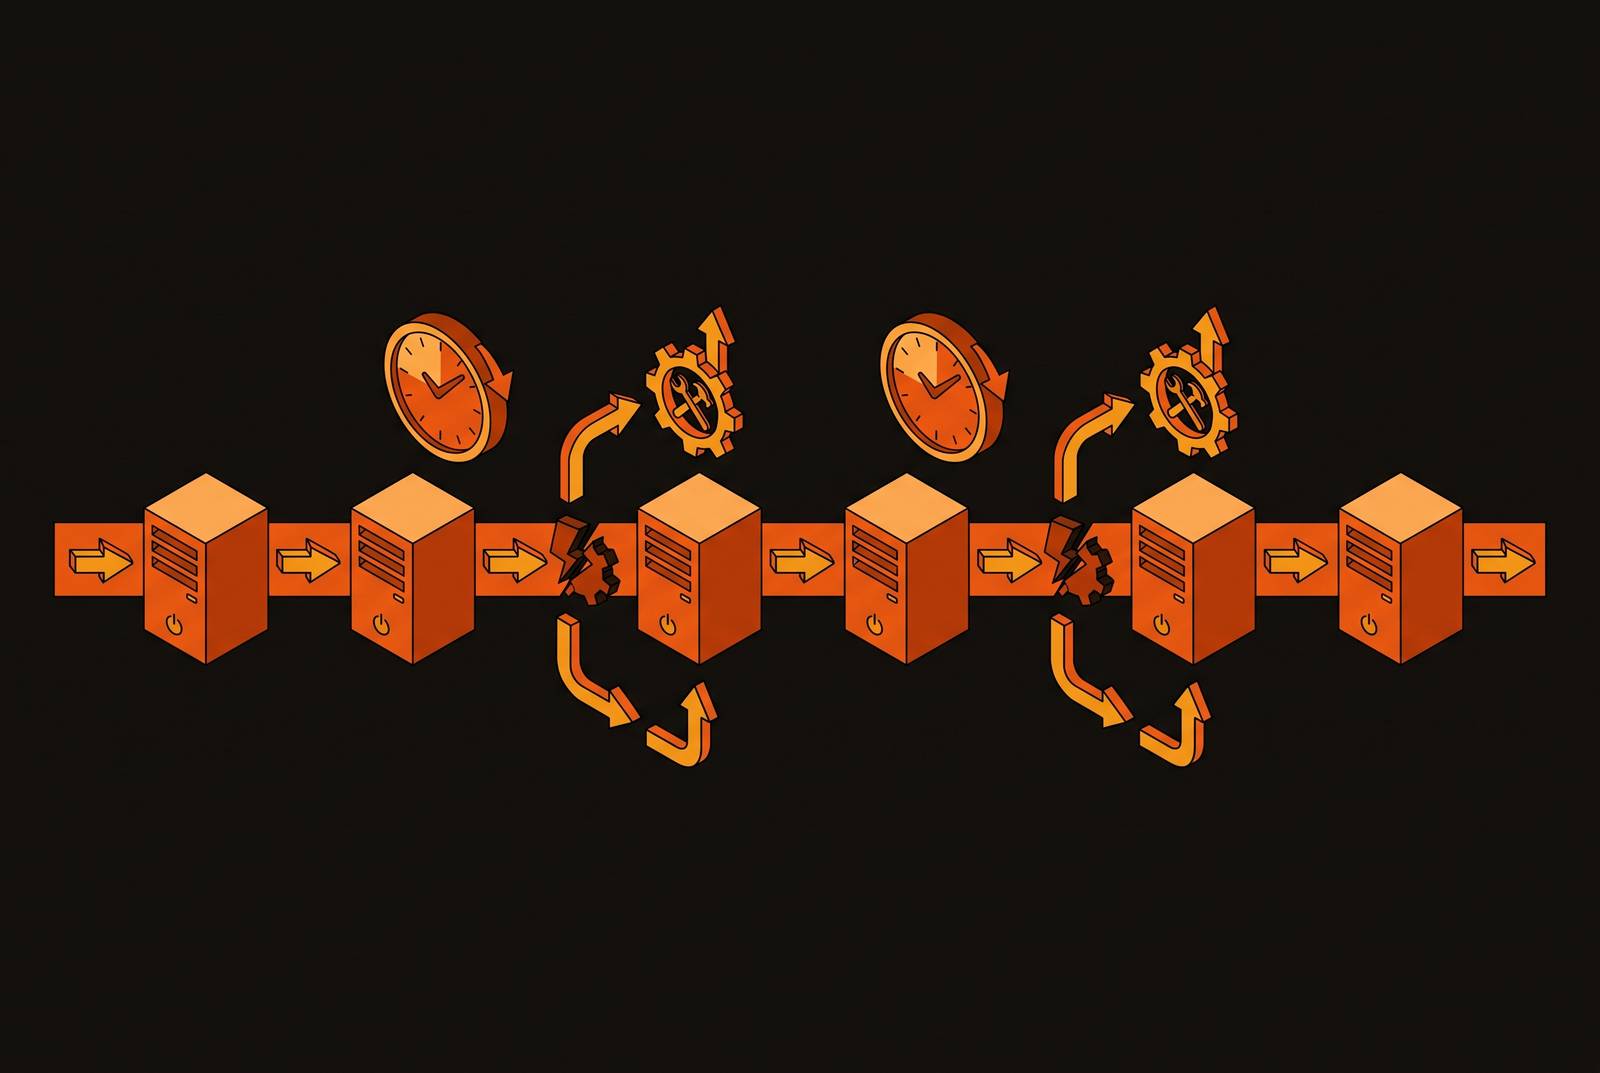
MTBF, mean time between failures, sounds like a settled question: divide uptime by the number of failures, get a number, gate a release on it. Plenty of engineering teams already do exactly that, treating the resulting figure as a pass/fail line before shipping. That practice is common enough that understanding what the number actually contains, and what it leaves out, is a release-engineering concern.
What MTBF measures, and what the formula silently excludes
Start with the arithmetic, because it's genuinely simple: total uptime divided by the number of failures. That simplicity is exactly why the metric spread so widely across hardware reliability work and, later, into software shops. It's also exactly why it hides so much.
The word "repairable" carries more weight than it looks like it should. MTBF describes systems that get fixed and returned to service, a cycle of breaking down and coming back. MTTF, mean time to failure, describes something different: the lifespan of a part that gets replaced rather than repaired. Confuse the two and the decision that follows is often the wrong one, because a team ends up planning a repair cycle for something that should have been swapped out, or budgeting replacement for a system that was always meant to be patched and kept running.
None of this would matter much if MTBF stayed a descriptive, after-the-fact number. It doesn't, because once a number decides whether code reaches production, the assumptions baked into that number stop being. Teams use it as a gate: no release ships unless the service clears a minimum MTBF threshold. Once a number decides whether code reaches production, the assumptions baked into that number stop being someone else's theoretical concern.
The equal-weighting problem: how MTBF collapses severity into a single average
Every failure that enters the MTBF denominator carries the same weight, no matter what it actually did to the system. A brief reset on a sensor nobody depends on and a multi-hour outage on the system processing payments get counted identically. The math treats every incident with the same weight, and that's the flaw worth sitting with, because it carries the weight of a structural failure. It's structural.
Two services can post the exact same MTBF and describe two entirely different risk profiles. One might rack up a string of minor, forgettable blips. The other might sail along cleanly for long stretches and then take a catastrophic, rare hit. Averaged out, they look the same on a dashboard. Operationally, they are nothing alike, and a team betting its release confidence on the averaged figure is making a bet on the wrong variable.
The number feels precise. It has decimal points, sometimes. That precision is cosmetic, though, because it sits on top of a distribution the formula never shows you.
Where MTBF earns its keep is narrower than its popularity suggests: trending the same asset over time, where the failures being averaged are roughly comparable in severity from one to the next. Used that way, a rising or falling MTBF for a single, consistent workload tells you something real. Used to compare two different systems, or to stand in for the shape of risk underneath it, the average becomes a distraction with a number attached.
The hidden time MTBF does not count: detection and acknowledgment
MTBF's blind spot extends beyond severity. It's also about time, specifically the time before anyone knows something is wrong. Total downtime breaks down more honestly into MTTD (Mean Time to Detect), MTTA (Mean Time to Acknowledge), and MTTR (Mean Time to Repair). MTBF's usual companion metric, MTTR, only covers the last of those three phases.
Ignore detection time in the accounting and organizations routinely end up underestimating how much of their system's life is actually spent broken. That's not a rounding issue either. A system can post excellent MTBF and MTTR figures side by side and still be quietly unreliable in practice, if the gap between something breaking and someone noticing keeps stretching out. The metric offers no warning light for that condition, because it was never built to look for one.
Nothing in MTBF looks upstream, either, at whatever pipeline is supposed to raise a problem in the first place. Whether monitoring actually fires, whether the alert that fires is one a human can act on, whether the engineer on call is looking at a signal that means anything: MTBF has no opinion on any of it. The availability formula, MTBF divided by MTBF plus MTTR, at least puts reliability and repair speed into a single ratio. But a team that spends a quarter shaving minutes off MTTR while detection time keeps drifting is optimizing a smaller portion of the problem, and calling it progress.
Why predicting software MTBF is harder than measuring it
Measuring MTBF after the fact and predicting it before a release are two different jobs, and software makes the second one much harder than the first. Hardware reliability engineering has a long head start here: wear curves, fatigue data, component datasheets. None of that transfers cleanly to code.
People have tried anyway. Lines of code, bug counts, counts of conditional branches, all have been floated as inputs to a predictive MTBF model. None of it has held up in commercial practice. The attempts remain experimental, which is a polite way of saying they haven't earned a place in a real release process.
Part of the reason is that software doesn't fail the way hardware does. A bearing wears down on a schedule you can plot. A software system fails because of a logic error, a race condition, state corruption, a config value nobody re-checked after a migration, a dependency that shipped a silent breaking change. None of those causes wears down predictably over time the way a physical part does.
According to the State of Production Reliability and AI Adoption Report, a large majority of organizations use four or more tools during a live incident, most experienced incidents where no alert fired at all, and a substantial share had outages tied to alerts that were ignored or suppressed. ISO/IEC 25010:2023 frames software reliability as faultlessness, availability, fault tolerance, and recoverability (a multidimensional model that a single average cannot represent). This prediction gap matters for release decisions: teams setting a threshold of 180 hours are measuring past behavior, not forecasting future reliability under changed conditions.
What Weibull analysis and failure-distribution thinking reveal that MTBF hides
That assumption holds up reasonably well during the middle of a system's life, the stretch reliability engineers call "useful life". It holds up much worse everywhere else.
Weibull analysis, one of the more established alternatives, splits failure behavior into three distinct regimes instead of one average: early-life failures, sometimes called infant mortality, random failures during the stable middle period, and wear-out failures as the system ages. Plotted out, this produces the bathtub curve, high on both ends, flat in the middle, and MTBF quietly collapses all three of those regimes into a single flat number.
In software terms, early-life failures tend to look like deployment mistakes and configuration errors, the kind of thing that appears right after a change lands. Wear-out failures look different: dependency rot, technical debt piling up, an environment that's drifted slowly away from what the code was written to expect. Average those two very different failure modes together and reliability spending gets pointed at the wrong target. Adding redundancy to guard against random mid-life failures does nothing whatsoever for a deployment error that happens the moment a bad config ships.
This is where Reliability-Centered Maintenance earns its name: match the response to the actual failure mode in front of you, not to whatever the average says is typical. The idea comes out of fleet maintenance and industrial equipment, but it applies just as directly to a team deciding how to spend its next quarter of reliability work on a software service.
How production telemetry changes what you can measure after a deploy
None of the above matters if the failure data feeding MTBF is bad to begin with. Monitoring coverage, alert quality, and how fast detection happens are foundational requirements underneath MTBF. They're prerequisites for the number meaning anything at all.
Good observability doesn't make repairs faster by itself. It makes the fault easier to find, and finding it is most of the battle, because nobody fixes what they can't locate. That's the actual mechanism behind observability's effect on MTTR: faster isolation, not faster fixing.
Deploying without verifying observability is deploying blind. After a service goes out, a team should be able to confirm that metrics are flowing, logs are showing up, traces are being generated. If any of that pipeline is broken, the deploy is unverified, regardless of what a clean MTBF history from last quarter might suggest.
Instrumentation itself splits into two jobs that don't substitute for each other. Auto-instrumentation catches the infrastructure layer more or less for free: HTTP calls, database queries, gRPC traffic. Manual instrumentation is what captures the events a postmortem actually needs, things like "order created" or "payment authorized". Calculate MTBF off infrastructure signals alone and the number describes server uptime, not whether the business the software runs actually kept working.
Tying deployment evidence to an exact commit SHA, with a rollback artifact and documented recovery steps attached, grounds the whole reliability conversation in a specific, reproducible point in the codebase instead of a vague calendar date.
Most alerts that fire should lead to some actual remedial action. Fall short of that and the failure count sitting in MTBF's denominator is being inflated by noise, which pushes the calculated MTBF down in a way that has nothing to do with how the system is actually behaving.
How alert noise corrupts MTBF data at the source
The 2026 State of Production Reliability and AI Adoption Report paints a picture worth taking as a whole rather than as scattered data points. A large majority of organizations reach for four or more separate tools during a live incident. Most teams have lived through incidents where no alert fired at all. A substantial share have had outages tied directly back to alerts that got ignored or suppressed.
Each piece of that picture corrupts MTBF differently. A missed alert means a real failure never enters the count at all. A suppressed alert means the team knew something broke but it never got logged in a form MTBF can see. Tool sprawl means the timestamps marking when a failure started are inconsistent across systems.
Toil, plain manual work that shouldn't need doing by hand, produces all of that. The Catchpoint SRE Report 2026, surveying 418 SRE practitioners, puts median toil at a significant share of the working week, and much of it goes toward manually stitching together signals that a properly built system should correlate on its own. Every hour spent on that manual correlation is an hour added to MTTD, the detection phase MTBF was never designed to see in the first place.
The Google SRE Workbook's guidance on this is specific: no more than a small handful of actionable incidents per on-call shift, as a sustainable baseline. Blow past that consistently and the problem likely traces back to how the rotation itself has been set up. It's that the rotation itself has been set up wrong.
Put together, a stable-looking MTBF often reflects something other than a stable system. It can just as easily reflect a team that's gotten good at absorbing failures quietly, or bad at logging the ones that matter.
AI-generated code and its impact on MTBF baselines through accelerating change frequency
AI-assisted development is changing the ground MTBF stands on, and the change cuts both ways at once. The 2025 DORA State of AI-Assisted Software Development report ties AI adoption to higher delivery throughput and, in the same breath, to higher delivery instability. Only a small slice of teams hit elite-level change failure rates, while a large share still sit well above what counts as an acceptable threshold.
AI tools now write a substantial share of the code shipping in a given organization, and they save real time on the routine parts of the job. But that code churns at a meaningfully higher rate than code written by hand, and Google's 2024 DORA report found delivery stability going down, not up, alongside the throughput gains.
Faster churn means an MTBF baseline goes stale faster too. A 180-hour threshold set against last quarter's codebase says less and less the moment 41% of that code was written by tools rather than by the engineers who'd actually recognize its edge cases. The number keeps looking the same on the dashboard. What it's measuring has already moved.
The 2025 DORA findings make the shape of the trade-off explicit: a significant share of teams using AI coding tools saw deployment frequency climb while change failure rate climbed right alongside it. More throughput, more instability, and a shorter and shorter historical window for MTBF to average over before the underlying system changes again.
Atlassian's Teamwork Lab has a name for the bottleneck this creates further downstream: the "AI efficiency paradox." Individual engineers produce faster, but the work piles up at review and approval, and that backlog compresses the stabilization period a system needs between deployments, the exact window MTBF measurement quietly depends on existing.
What MTBF should and should not be used for in a modern reliability program
None of this makes MTBF worthless. It makes the honest use cases narrower than most teams assume.
MTBF holds up when trending a single asset over time, comparing one version of a service against another under matched load conditions, or setting a release gate like a 180-hour threshold, provided everyone involved understands that the gate reflects the past, not a forecast. It also still works as a shared, plain-language number for stakeholders who need one reliability figure to point to, so long as the engineers behind it know exactly what the average is hiding.
MTBF misleads the moment it's used to compare two different systems with genuinely different failure profiles, or to make a redundancy or capacity call without ever looking at the failure-mode distribution that the average is built from. It misleads just as badly when a stable MTBF gets read as proof that detection and response are healthy, when in fact a flat average can sit directly on top of a worsening MTTD problem nobody's tracking. And it misleads when a team uses a historical MTBF to forecast reliability for a service that just went through a major shift in its code, its dependency graph, or how often it deploys.
The metrics that make MTBF legible are the ones that surround it: MTTD for the detection gap MTBF was never built to see, MTTA for acknowledgment lag, MTTR for repair speed, and availability (MTBF over MTBF plus MTTR) as the single ratio that ties reliability and maintainability together. None of those numbers mean anything, though, without real production telemetry behind them. A passing test suite in CI says nothing about what a system does under actual traffic. The measurement, all of it, has to happen where the system is actually running.