On-Call Rotation Design for High-Deployment-Frequency Teams
Fast-deploying teams need rotation redesign paired with alert signal cleanup.
On-Call Rotation Design for High-Deployment-Frequency Teams.
Why high-deployment-frequency teams face a structurally different on-call problem
Traditional on-call design assumes production sits mostly still between planned releases, so a rotation just needs to catch the rare thing that breaks between changes. High-frequency teams don't get that luxury: production is never still, and every single deploy is a fresh opportunity for something to go wrong. The blast radius of any one bad change tends to be smaller when deploys are frequent and incremental, but the sheer number of changes means the cumulative exposure keeps climbing. Alert volume, escalation load, and the complexity of handing off a shift all start scaling with how often the team ships, not just with how many engineers are on the roster.
The data backs up what this feels like on the ground. Toil rose 30% according to the State of Incident Management report, the first increase in five years, and it happened despite teams adopting AI operations tooling at scale State of Incident Management 2026 runframe.io. The tools were supposed to fix this. Instead, 88% of developers now work more than 40 hours a week, and 73% of teams have had outages caused by alerts that got ignored because nobody trusted them anymore State of Incident Management 2026 runframe.io. A rotation schedule built for a slower era doesn't just feel outdated at high deploy frequency, it actively breaks down. Fixing it means rebuilding coverage windows, handoff cadence, escalation tiers, and alert standards from the ground up, not tuning the knobs on a system designed for a different kind of production environment.
The signal quality crisis that makes rotation redesign incomplete on its own
Most on-call problems that look like scheduling problems are actually signal quality problems in disguise runframe.io. You can redesign a rotation as carefully as you want, but if the alerts feeding into it are garbage, the new schedule just distributes the garbage more evenly. NeuBird AI's 2026 State of Production Reliability and AI Adoption Report, based on a survey of more than 1,000 SRE, DevOps, and IT operations professionals, puts numbers on how bad this has gotten.
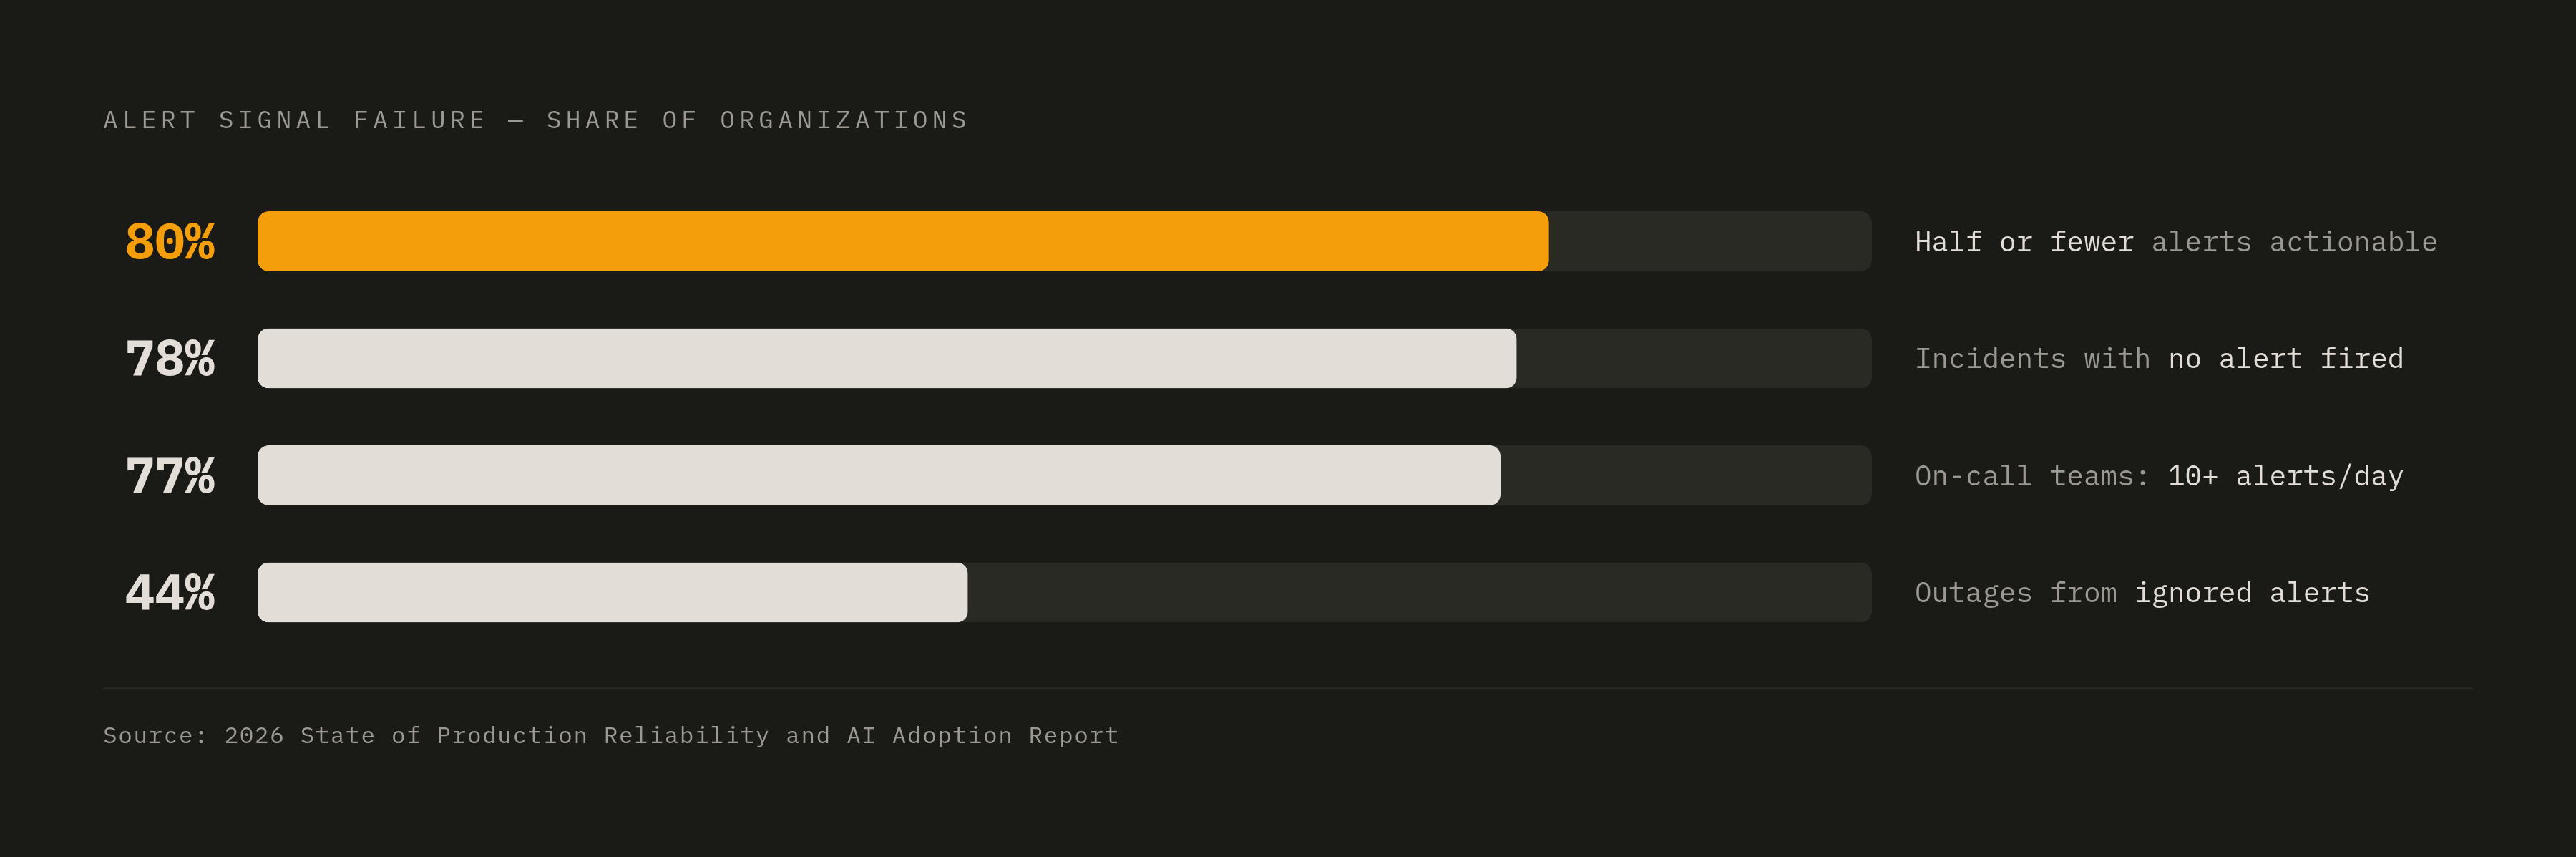
High-frequency teams sit inside a particular paradox here. More deploys mean more services, more code paths, and more instrumentation surface area, which sounds like a good thing until you realize it also means more candidate alerts competing for the same limited attention on the rotation. The volume goes up, but the signal-to-noise ratio doesn't improve on its own, and it often gets worse. That's the direct mechanism behind the 73% figure on trust erosion cited earlier: teams don't ignore alerts because they're careless, they ignore them because experience has taught them that most pages don't matter State of Incident Management 2026. The benchmark to aim for is an alert quality ratio above 80% actionable, and most teams, high-frequency or not, are nowhere close 2026 State of Production Reliability and AI Adoption Report vettedoutsource.com. Every section that follows on rotation design, escalation, and handoffs assumes a parallel push to fix signal quality is happening at the same time. Skipping that work means any improvement to the schedule just gets absorbed by the noise within a few weeks. The State of Production Reliability and AI Adoption Report found that 80% of organizations say half or fewer of their alerts are actually actionable 2026 State of Production Reliability and AI Adoption Report vettedoutsource.com. According to the State of Production Reliability and AI Adoption Report, 77% of on-call teams field at least ten alerts a day 2026 State of Production Reliability and AI Adoption Report. According to the State of Production Reliability and AI Adoption Report, 78% experienced incidents where no alert fired at all 2026 State of Production Reliability and AI Adoption Report. According to the State of Production Reliability and AI Adoption Report, 44% had outages tied to alerts that were ignored or suppressed 2026 State of Production Reliability and AI Adoption Report.
Alert hygiene as a prerequisite: the reduction sequence high-frequency teams should follow
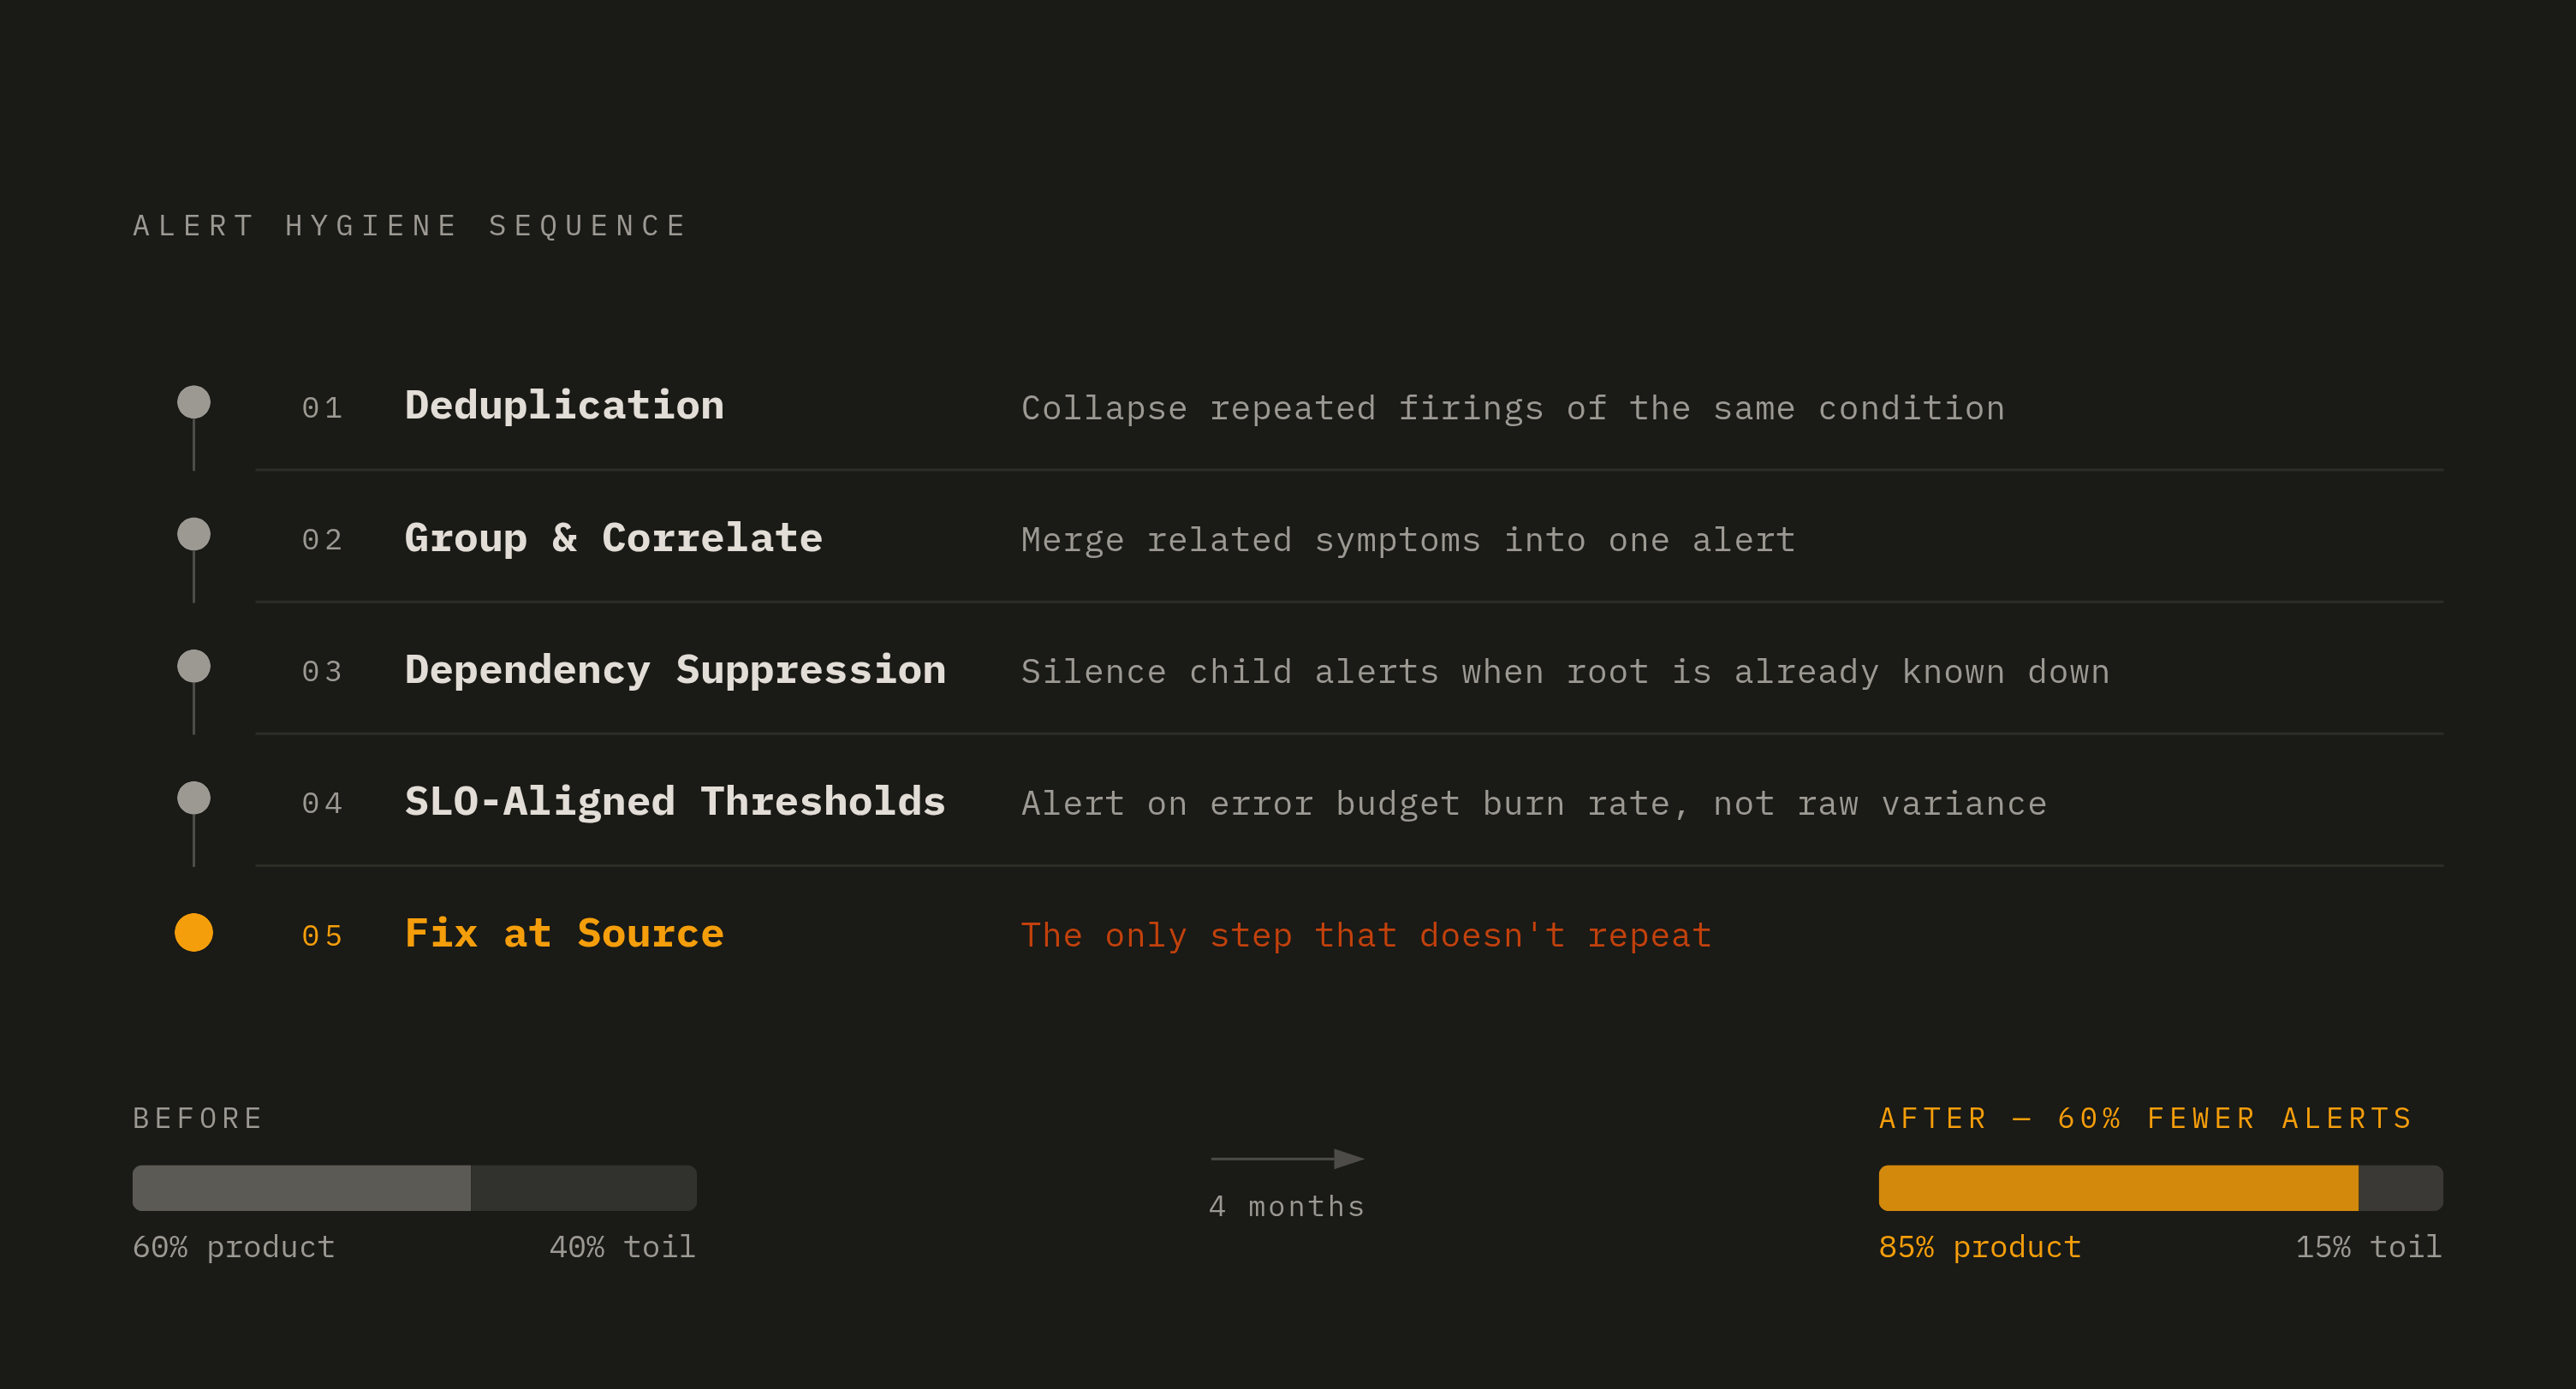
There's an order of operations here, and skipping ahead doesn't work. The sequence that actually holds starts with deduplication: collapsing repeated firings of the same underlying condition. From there, group and correlate related symptoms into a single alert instead of letting each symptom page separately. Next comes dependency-aware suppression, which silences child-service alerts once the root dependency is already known to be down. After that, move from raw metric thresholds, which fire constantly on normal variance, to SLO-aligned thresholds that alert on error budget burn rate instead. The last step, and the only one that doesn't need to be redone every few months, is fixing the instrumentation at the source.
Ownership matters as much as the sequence. Every alert needs an assigned owner, a specific engineer tied to the code or service behind it, someone with the context and the authority to either fix the underlying issue or delete the alert if it's no longer useful. This isn't a theoretical exercise. One team using AI-backed alert management cut alert volume by more than 60% over four months, not through suppression but by fixing the underlying issues before they ever triggered a page, which moved the team's time split between product development and operational toil from roughly 60/40 to 85/15 neubird.ai runframe.io. For teams shipping constantly, this needs to become a gate, not an afterthought: a new service shouldn't enter production and start paging the rotation until its alerts have been reviewed by an owner and meet the team's own actionability bar.
Choosing a rotation pattern based on your deployment rate and team size
There's no universally correct rotation pattern. What fits depends on incident volume, which tracks closely with deploy frequency, plus team size and how spread out the team is across time zones. The strength of this model is continuity: the on-call engineer accumulates context across a week of related deploys, and fewer handoffs means less dropped context. The risk for high-frequency teams is that a single bad week can burn out one person fast, so this pattern only holds up when it's paired with strict alert quality controls.
It spreads the load more evenly, but it comes at the cost of more frequent handoffs, and each handoff is a chance to lose context, especially painful when multiple deploys are landing daily.
Follow-the-sun rotations pass on-call responsibility across regions as the workday moves, and they suit companies with genuine global engineering presence and round-the-clock SLA commitments. A SaaS platform running this model can cut night-hour on-call load per engineer by as much as 67% compared to a single-timezone 24/7 rotation neubird.ai. That number only holds if the handoff mechanics are right, though: a 15-minute overlap window and a written handoff channel, something like a dedicated #on-call channel, are what actually transfer deploy context from one region to the next runframe.io.
Shift-based rotations split each day into 12-hour day and night blocks. This limits after-hours burden and tends to work better for larger teams, but it needs more engineers to staff and adds real scheduling complexity. Google's SRE guidance offers a useful health check regardless of which pattern is chosen: no more than two pages per 12-hour shift Google SRE. If a rotation is consistently blowing past that number, the problem is usually something else. It's that the alert hygiene work from the previous section never actually got done. This rotation pattern is best for teams of 4–8 engineers, with services with moderate incident volume. On-call rotates every 24 hours runframe.io. Informal "whoever's around" systems work at roughly 10–15 people; around 40–50 people they fail in predictable ways vettedoutsource.com runframe.io. For 24/7 coverage with backup, meaningful team sizing math applies (aim for at least 6–8 engineers in a rotation for sustainability).
Structuring escalation tiers for teams where every deploy can be the cause
High-frequency teams need one structural addition to that chain, though. The engineer currently on-call is very often not the engineer who wrote the deploy that's causing the incident, so the escalation path needs a mechanism to pull in the deploying engineer directly whenever the incident signature matches a change from the recent deploy history.
Roles need to be spelled out, not assumed. Primary is the first responder, owning triage and initial assessment. Secondary backs up primary if there's no response, helps out during incidents that need more than one set of hands, and shadows newer engineers learning the rotation. Backup domain experts, the people who understand a specific database, network layer, or compliance requirement in depth, get looped in only when the incident actually calls for that expertise, not on every page. Separate from all of these is the incident commander, whose job during a major incident is coordination.
None of this should live in one senior engineer's head. The escalation policy needs to be a written artifact: acknowledge SLA, escalation timing, and the trigger for pulling in a manager, all defined in version-controlled configuration that sits alongside the schedule itself. Skipping that step produces what's sometimes called alarm bouncing, where an alert cycles through the whole chain without anyone actually having the context to act on it. The root cause is almost always missing deploy metadata or fuzzy role boundaries. The cost of getting this wrong is real money, not just frustration: per itoc360, poor on-call scheduling drives longer MTTA and MTTR directly, and a 15-minute delay in acknowledgment caused by a stale schedule can translate into tens of thousands of dollars in lost transactions on a high-volume payments platform neubird.ai runframe.io. Tool sprawl makes all of this worse. Escalation design should aim to cut that number down, not add to it. The standard escalation chain has the primary on-call acknowledge within 5 minutes; if no acknowledgment, it escalates to secondary after 5 minutes, then to a manager or team lead runframe.io. 83% of organizations juggle four or more tools during a live incident, and since tool sprawl at escalation time multiplies the cost of every minute, escalation design should minimize the number of systems an engineer must consult before acting 2026 State of Production Reliability and AI Adoption Report.
Handoff design when deploys happen faster than shifts change
In a weekly rotation a single handoff transfers context for perhaps one or two releases, while in a team shipping many times per day the incoming engineer inherits the footprint of dozens of changes. This is the core mismatch that high-frequency teams have to design around.
Verbal handoffs don't scale here, and they stop working reliably around the same 40-to-50-person mark where informal scheduling breaks down vettedoutsource.com runframe.io. A written handoff needs to become non-negotiable, even if it's as short as two minutes to produce vettedoutsource.com runframe.io. What that document needs to capture is specific: every deploy since the last handoff, including the service name, the deploy time, who deployed it, and whether post-deploy verification actually ran; any incidents that opened or closed recently and which deploy they trace back to; alerts that fired and got resolved, not just the ones still open; any service everyone knows is fragile or hasn't been fully verified in production yet; and runbooks relevant to anything that shipped since the last shift ended.
For teams running follow-the-sun, an insufficient overlap window causes deploy context to go unconfirmed, leading to missed handoffs and slower incident response. Thirty minutes of mandatory overlap with a dedicated sync channel is the structural minimum, and it's the point where deploy context gets verbally confirmed before the outgoing engineer actually steps away runframe.io. There's a simpler visibility fix that pays off daily too: posting who's currently on-call and who's next, visibly, to the whole team at the start of each shift. That single habit collapses the kind of 20-minute "who's supposed to be responding right now" delay that occurs when nobody's sure whose rotation it is runframe.io. And the handoff document itself doubles as a diagnostic tool. If it's consistently long, or keeps carrying unresolved items forward from shift to shift, that's an early sign the rotation is overloaded relative to alert quality and deploy volume, and it's worth reviewing both before the team burns out.
Post-deploy verification as the structural fix for deploy-driven alert volume
Most of the incidents that actually reach on-call are the ones pre-merge testing was never going to catch, because they only appear under real traffic, real data, and real infrastructure. This is where the industry's own numbers are sobering. The 2025 DORA State of AI-Assisted Software Development report, drawing on nearly 5,000 tech professionals surveyed by Google Cloud, found that only 16.2% of organizations achieve on-demand deployment frequency, just 8.5% hit elite-level change failure rates of 0 to 2%, and 39.5% of teams still see failure rates above 16% runframe.io thegoodshell.com. CI passing tells you the code works in isolation. It says nothing about how the code behaves once it's actually running.
The shift-right principle addresses this directly: treat the deployed system itself as the thing under test, not just the code sitting in the repository. That means continuous validation using production telemetry, traces, metrics, and logs together, plus canary analysis and SLO burn-rate monitoring running against the live system. Canary deployments turn this into an actual rotation protection mechanism. Roll a new version out to a small slice of traffic, watch its error rates and latency separately from the stable version, and if the canary starts degrading, roll it back automatically, before the page ever reaches a human being on the rotation. That link between observability and the deployment pipeline is what separates a team where on-call catches every regression from a team where the system catches most of them first.
Observability itself should be a deploy gate, not something bolted on after the fact. After a new service goes live, check that metrics are flowing, logs are landing, and traces are being generated, and if that instrumentation is broken, the deployment should fail rather than get handed to an on-call engineer with no visibility into what just shipped. Observability-as-code helps make this automatic: dashboards and alerts live in the same repository as the application code, so when the service deploys, its telemetry deploys with it, closing the gap where a new service goes live with nothing wired up to page anyone meaningfully. The payoff for getting this right is large. Good observability cuts MTTR by 50 to 70%, because an engineer who can trace an error count straight to the failing span and the relevant log line resolves the issue in minutes rather than hours vettedoutsource.com. Tooling built for this layer, automatic post-deploy verification against real production telemetry that catches regressions and opens fix pull requests before they ever generate a page, moves the work of the rotation earlier in the pipeline, so fewer incidents reach a human being in the first place.
Closing instrumentation gaps that create blind spots during high-frequency shipping
Root cause analysis in a microservices environment leans heavily on distributed tracing to reconstruct the call graph between services, and that only works if trace coverage is actually complete. In practice it rarely is. Services ship without tracing instrumentation all the time, quietly, and each one becomes a blind spot the next incident has to work around.
OpenTelemetry has become the standard answer to this, largely because it decouples how telemetry gets generated from how it gets analyzed: instrument a service once, and send the data to any OTLP-compatible backend. It comes with stable SDKs and automatic instrumentation for a wide range of commonly used libraries, which lowers the bar for getting a new service wired up on day one. Roughly 75% of organizations now use tooling in this category, but adoption alone doesn't solve the problem edgedelta.com. Collecting large volumes of unstructured telemetry data often just adds noise instead of clarity, and it can slow root-cause analysis down rather than speed it up edgedelta.com. Coverage is necessary, but it was never the actual goal.
A hybrid approach tends to close the gap more completely. Zero-code instrumentation using eBPF gives immediate baseline visibility across a service with no code changes required, which matters a lot for a team shipping new services constantly and needing telemetry from minute one. Neither approach on its own gets a high-frequency team where it needs to be. The baseline visibility from automatic instrumentation catches the blind spots; the manual layer on top gives on-call engineers the context to actually understand what a trace is telling them once they're staring at it during an incident. 40% of organizations link distributed system complexity to outages (observability gaps directly impact reliability, and the gap compounds with each new service that ships uninstrumented) 2026 State of Production Reliability and AI Adoption Report edgedelta.com runframe.io. Manual OTel SDK instrumentation adds business-logic context that auto-instrumentation cannot see, such as "processing a payment" or "running a fraud check". The two approaches should. SOURCE PAGES, what the pages behind the outline's links say.