Reducing Mean Time to Resolution with Automated Diagnosis
Automated diagnosis shrinks the diagnostic gap that slows incident resolution.
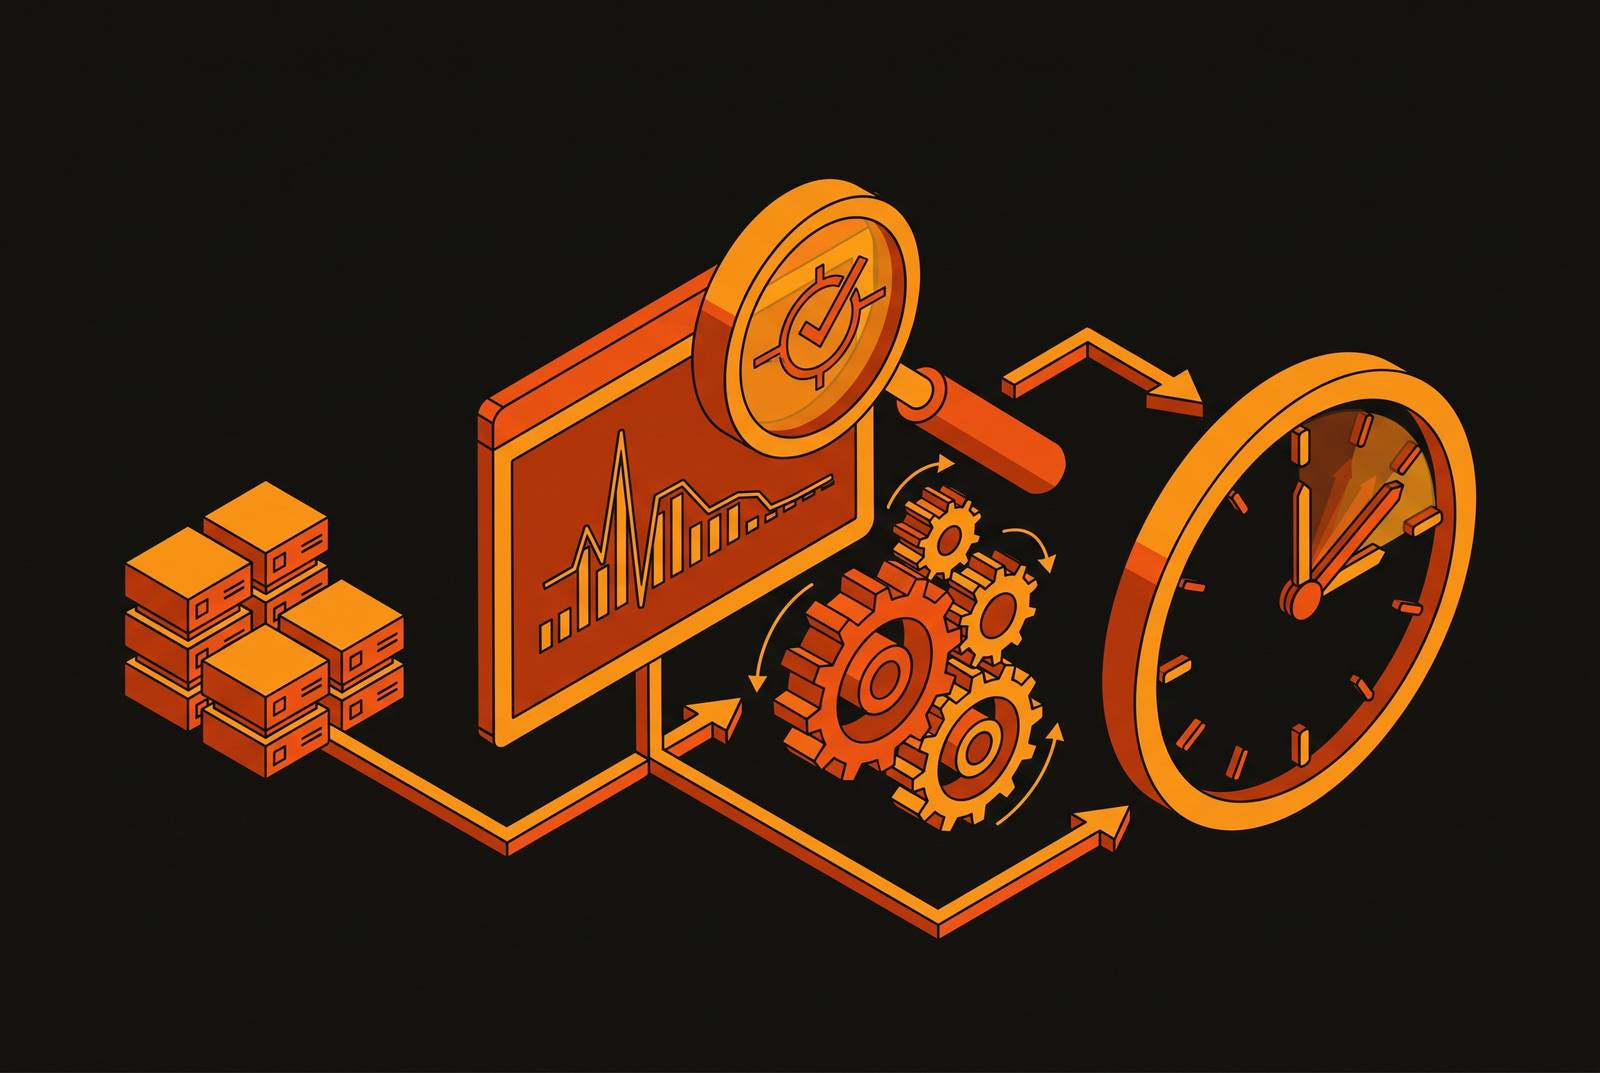
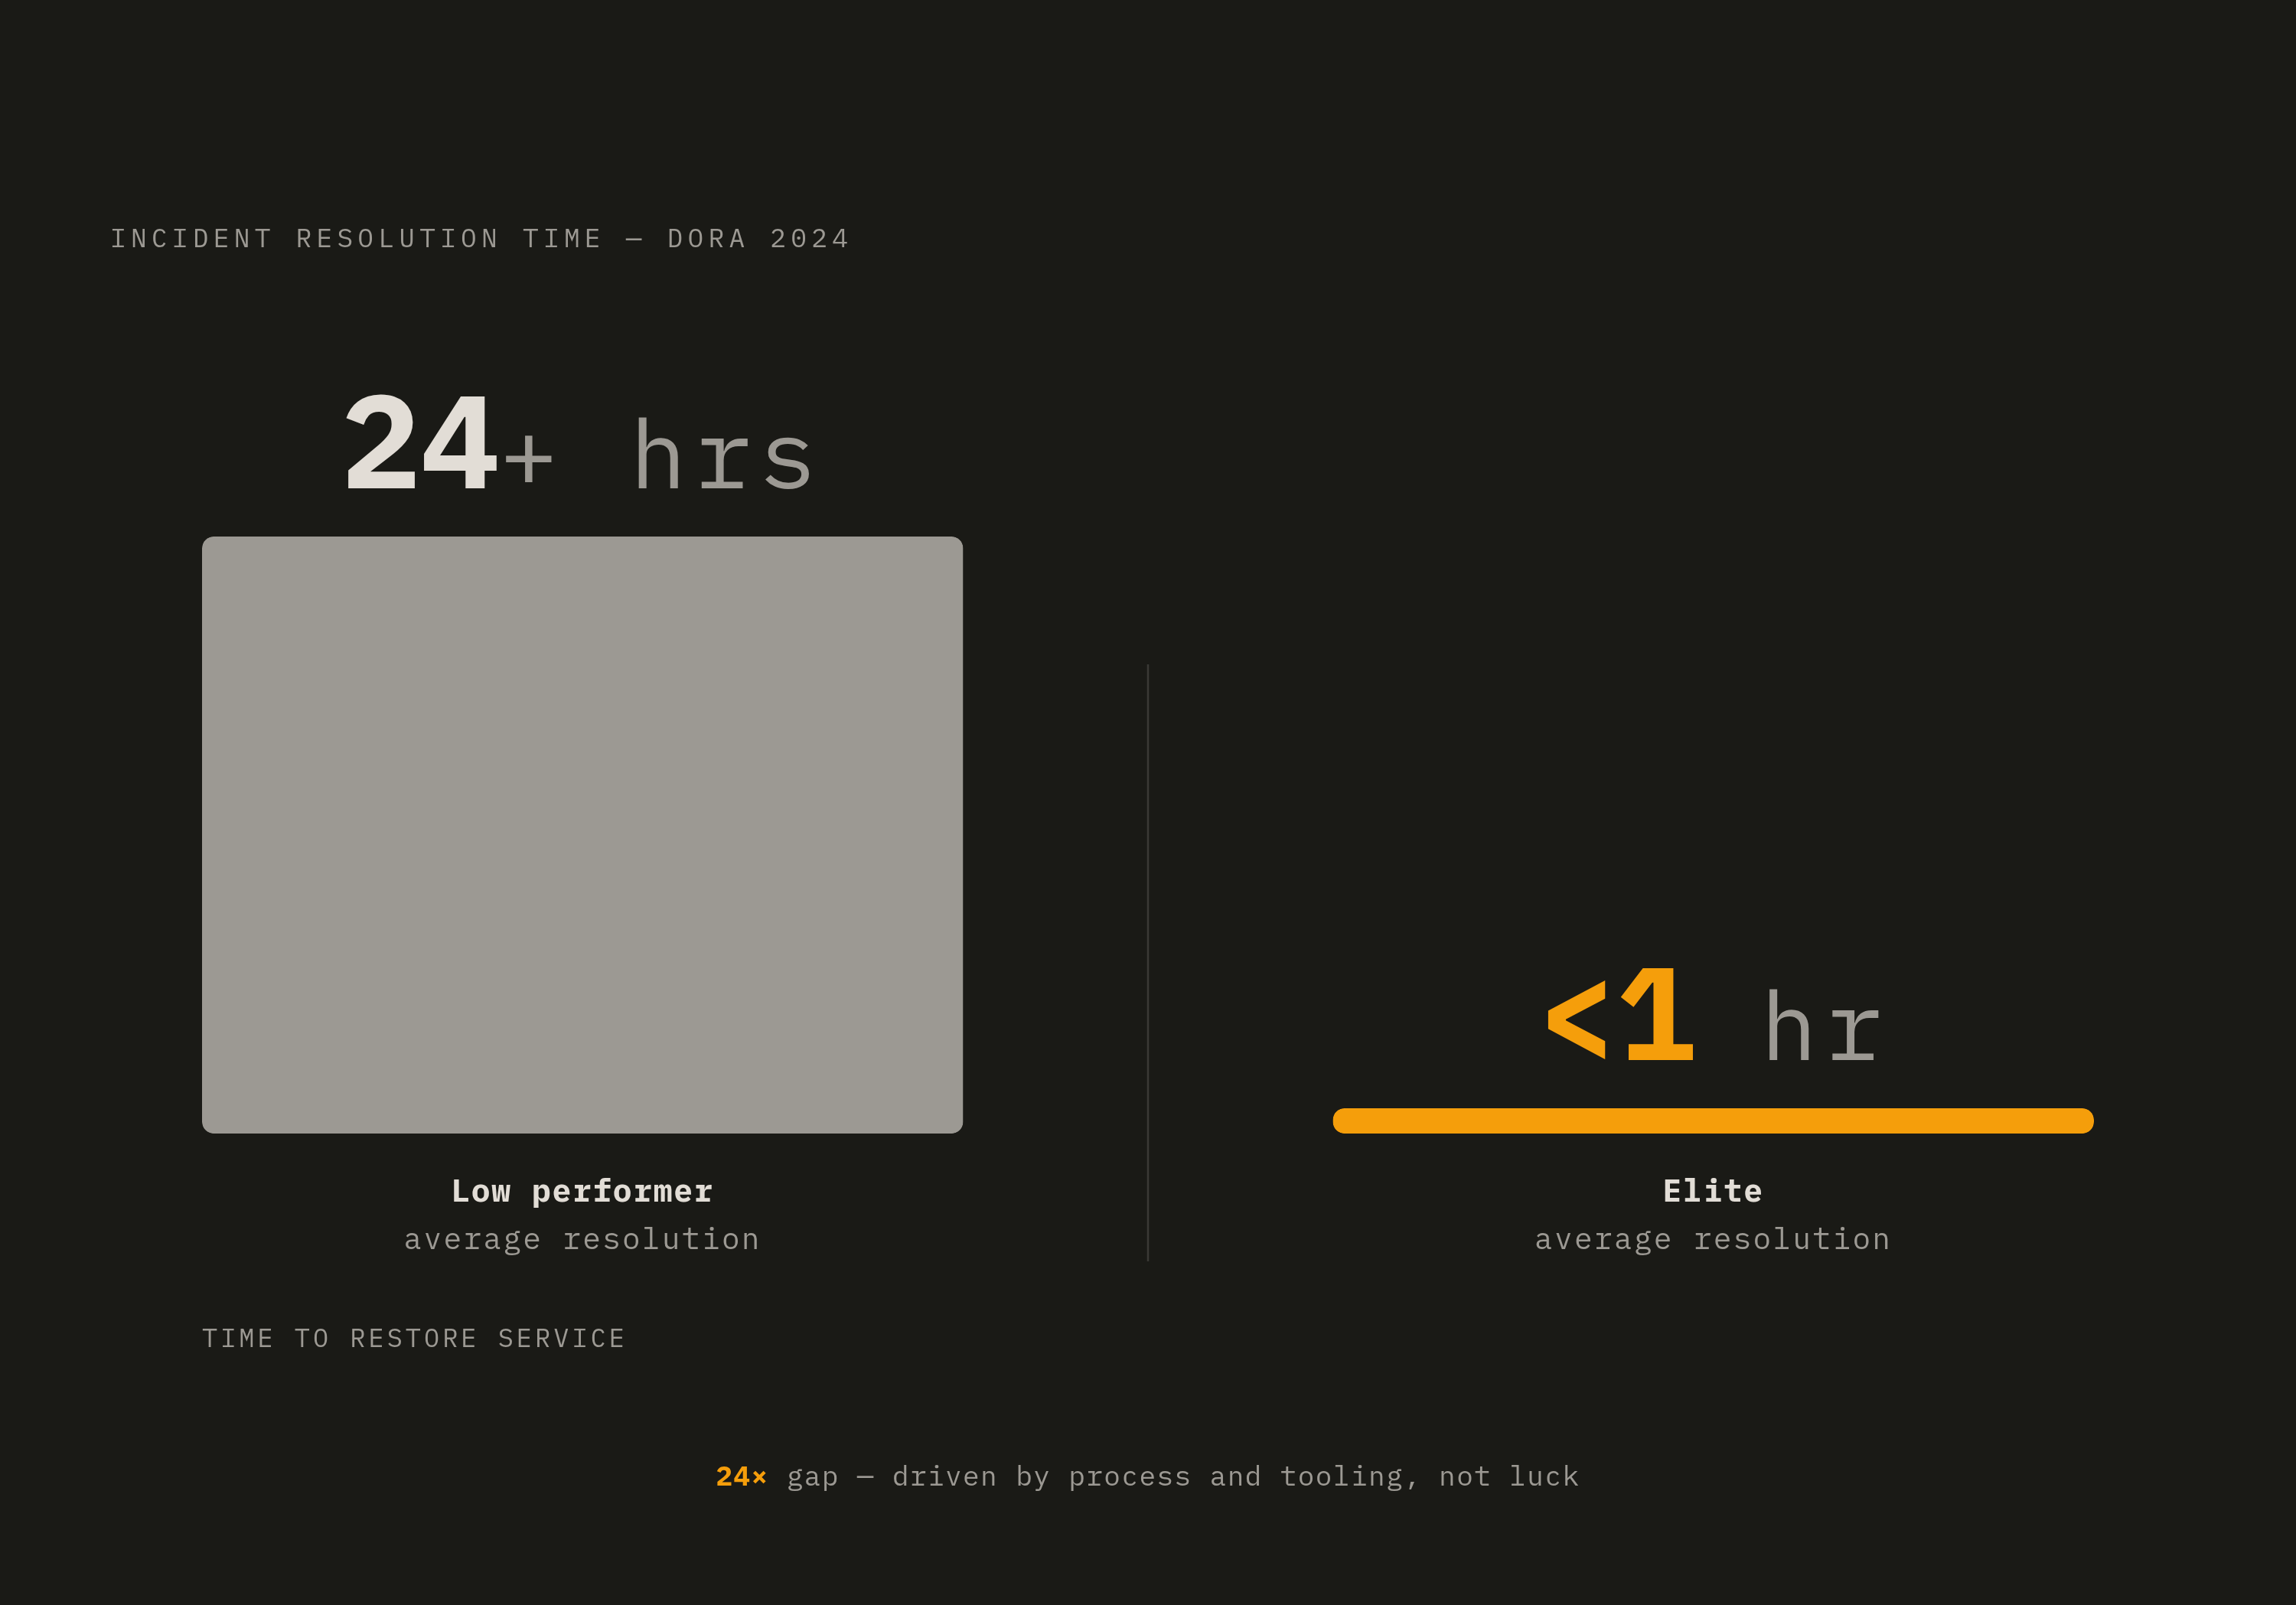
MTTR breaks into four clocks stitched together: time to triage, time to contain, time to eradicate, time to recover. Most engineering organizations spend their improvement budget on the first mile, better alerting, faster paging, or the last, war-room discipline, cleaner runbooks, and they leave the middle untouched. That middle is the diagnostic gap: the stretch between "something is wrong" and "we know what, why, and where." DORA's 2024 benchmark puts a number on what that gap costs: elite teams resolve incidents in under an hour, low performers average more than 24 hours, and the spread tracks a single variable, whether diagnosis runs on process and tooling or on a responder's memory and luck. Most companies are still betting on memory, and the bet is the wrong one: it optimizes the two phases that were never the bottleneck.
What the diagnostic phase actually looks like when it runs manually
An alert fires, someone gets paged, opens a dashboard, then another, then pulls logs from a service that may or may not be the actual source of the problem, then tries to correlate timestamps across systems that were never built to be read together. That sequence is the default at most companies, and it is slower than it looks on paper, because distributed systems distribute the pain along with the workload. The symptom shows up in one service; the root cause lives in another, often owned by a different team running different tools entirely.
Diagnosis in that environment leans on institutional knowledge no alert carries with it. Knowing which services talk to which, which deployment went out an hour ago, who owns the flaky dependency three hops downstream: none of that rides along with the page. It lives in someone's head, and if that someone is asleep or on a plane, the clock keeps running while a less-informed responder rebuilds the map from scratch.
Every additional tool opened during an outage burns SLO. The cost isn't the few seconds it takes to open a new tab; it's the reload of the mental model each time, the responder re-establishing what they were looking for and why. Catchpoint's 2025 SRE Report, surveying 301 practitioners, found operational toil rose to 30% of SRE time, its first increase in five years. Toil was supposed to shrink as tooling matured. It grew instead, and that is the tell: tooling spend has been aimed at the wrong phase of the incident lifecycle. Better paging notifies more people of a slow diagnosis faster, without making the diagnosis itself any faster. That is the whole problem in one sentence, and most roadmaps still don't say it out loud.
Alert noise as a tax on diagnostic clarity
Alert fatigue gets described as a discipline problem, as if responders just need to pay closer attention. That framing has the causality backwards: ignoring alerts is a rational response to a broken signal, not a lapse in professionalism. Splunk's State of Observability 2025 survey of 1,855 organizations found 73% had experienced outages linked to alerts that were ignored or suppressed. History has taught responders, one false alarm at a time, that most alerts don't mean anything actionable.
Three kinds of noise do most of the damage: false positives firing from thresholds set without enough baseline data, redundant notifications repeating the same root cause across five different monitors, and over-sensitive triggers flagging deviations nobody needs to act on. The compounding cost lands on diagnosis itself: once responders stop trusting the page, every investigation starts from skepticism, and the first several minutes go to confirming the problem is real before anyone can begin to characterize it. A team where fewer than 10% of alerts are actionable has a real noise problem; healthy systems land closer to 30–50% actionable rates.
Sending fewer pages for the sake of a smaller number solves nothing. What holds up is making the signal trustworthy enough that a responder acts on it the moment it lands, instead of re-litigating whether it's real.
What automated diagnosis actually does, mechanically
Automated diagnosis works differently from automated alerting, and conflating the two is where most vendor pitches go wrong. Alerting fires faster; diagnosis interprets. It takes telemetry that would otherwise sit scattered across separate dashboards, logs, metrics, traces, and evaluates all of it together, continuously, hunting for correlation instead of waiting for a human to draw the line by hand.
A handful of mechanical capabilities do the actual work. Change-event linkage ties a symptom spike to the most recent deployment, config push, or dependency shift, pointing at what changed right before latency rose instead of just reporting that it rose. Service topology awareness means the system already knows which services depend on which, so a database latency spike maps immediately to its downstream blast radius rather than waiting on someone to trace the dependency graph by hand. Automated log scanning catches spikes in error codes, 5xx and 4xx counts climbing past baseline, without a human pulling a log stream and eyeballing it. Dynamic baseline comparison tells a genuine regression apart from ordinary variation, something static thresholds are structurally bad at.
What lands in the responder's lap is a scoped, ranked hypothesis: here's what probably broke, here's where, here's the evidence already assembled. CI passing tells a team almost nothing about production behavior; it's a necessary check, not a sufficient one, and treating it as proof of health is the mistake that keeps causing 2 a.m. pages. Automated diagnosis works against live production reality, and the right trigger for it is the deploy itself, not the moment a human notices something looks off two hours later.
Where automated diagnosis compresses the clock
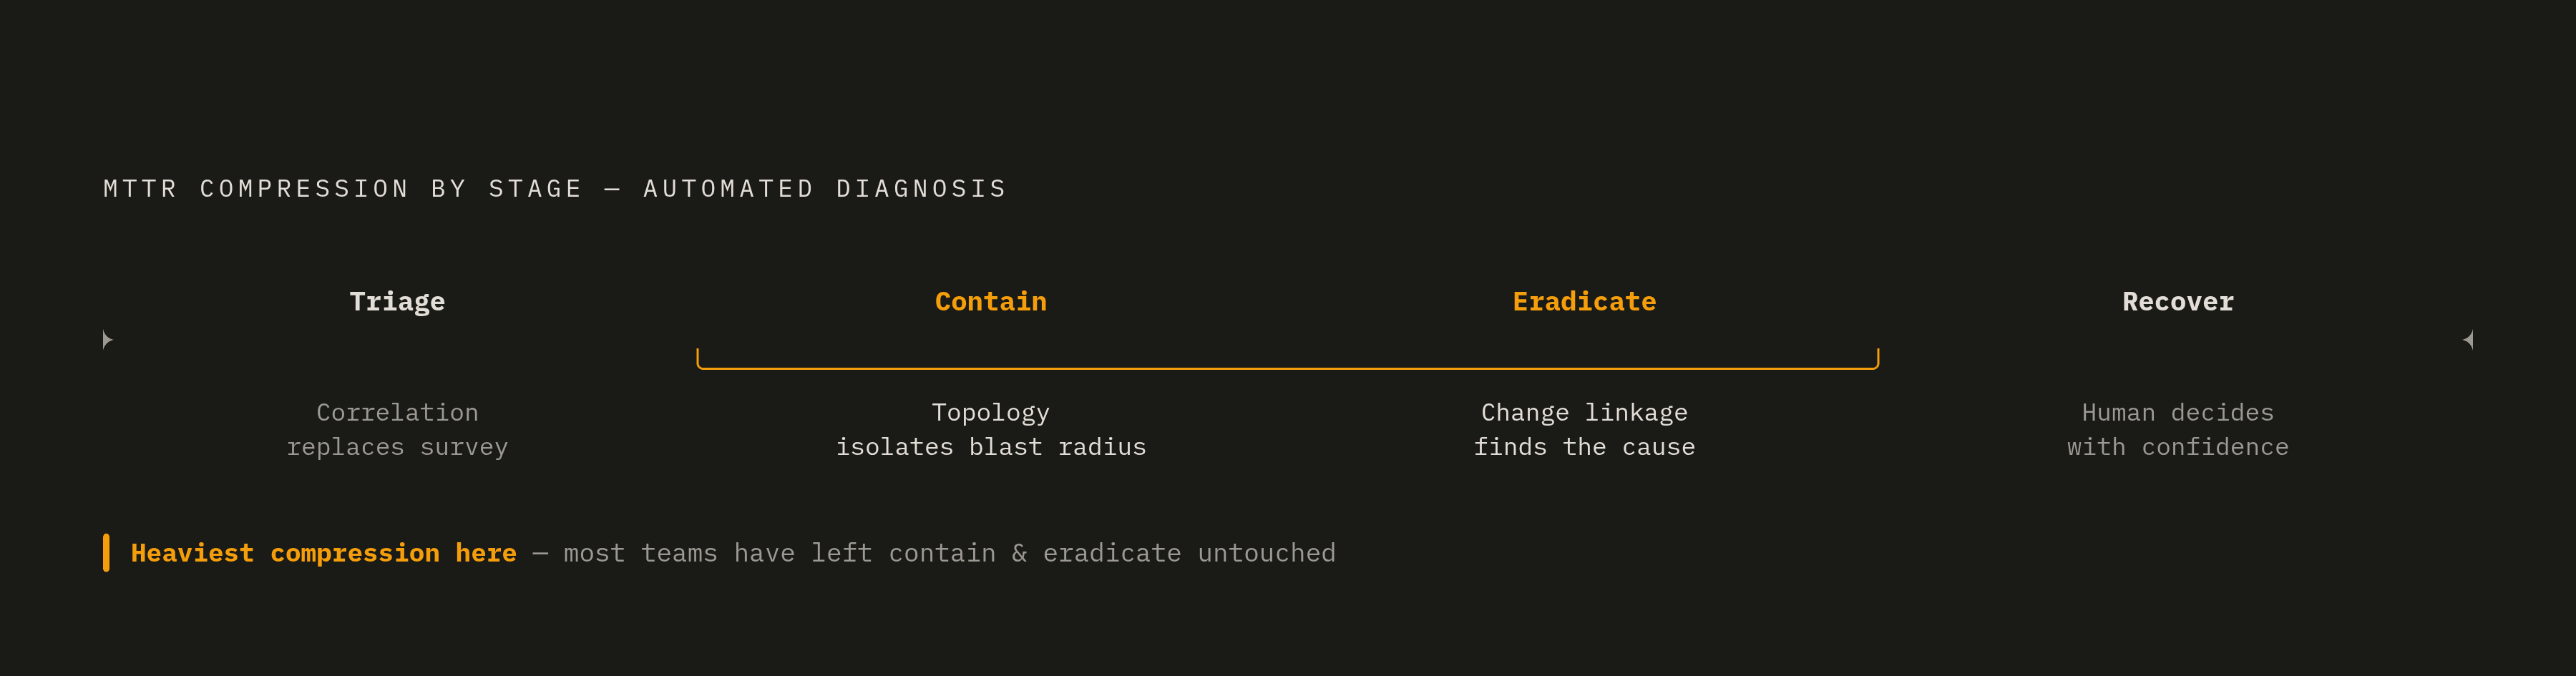
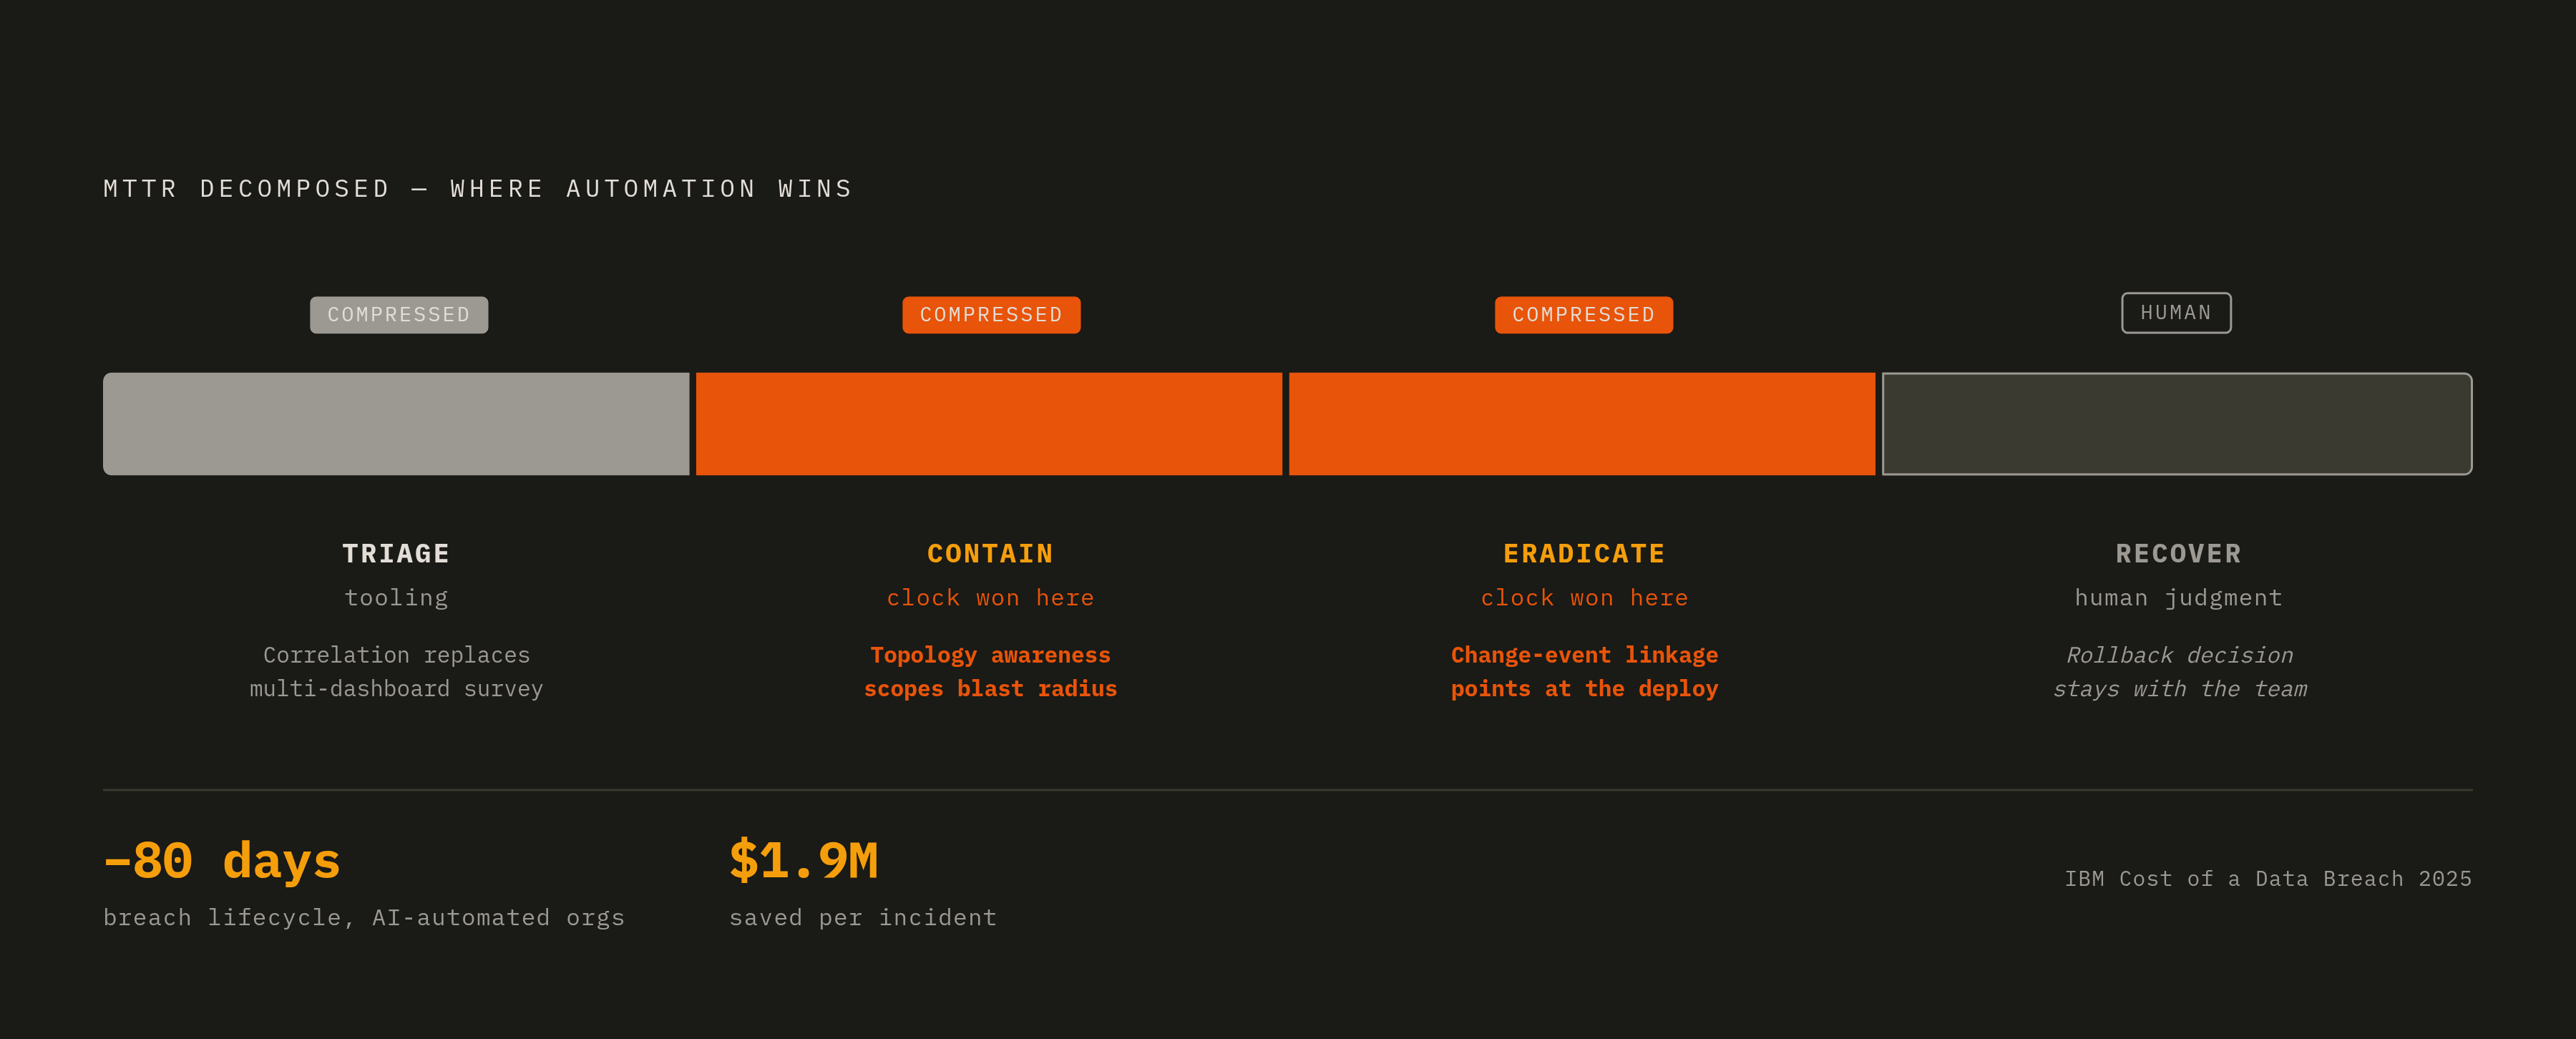
Map the capabilities onto the four subcomponents of MTTR and the compression stops being aspirational. Time to triage drops because correlation replaces the multi-dashboard survey; the responder starts with a hypothesis instead of a blank search. Time to contain drops because topology awareness tells the team exactly which service or dependency to isolate, instead of leaving them to guess at the blast radius under pressure. Time to eradicate drops because change-event linkage points straight at the likely cause, the deploy, the config change, instead of leaving someone to reconstruct a timeline from scattered logs after the fact.
IBM 2025 data gives a sense of the scale involved: organizations using AI and automation extensively shortened the breach lifecycle by 80 days and saved $1.9 million per incident. That figure belongs in the same category as spend on redundancy or testing infrastructure: structural, not optional.
Those savings come from compressing diagnosis and containment, not from paging faster or writing tidier Slack updates. A responder still decides whether to roll back, patch forward, or throttle traffic; none of this replaces human judgment on the actual fix. What changes is how fast that responder gets to the point where the decision can be made with confidence.
How the on-call experience changes when diagnosis is automated
The baseline is getting harder, not easier. Harness's State of Software Delivery 2025, surveying 500 developers, found 92% believe AI tools have widened the blast radius of bad deployments. More code shipping faster means more incidents to triage, full stop.
Against that backdrop, automated diagnosis changes the shape of on-call work, not just its volume. Low-risk incidents get diagnosed, contained, and documented without ever generating a page, while engineers get paged for decisions, not investigations, arriving to a page that already carries context instead of a blank slate. Every diagnosis and fix becomes encoded knowledge the system draws on the next time something similar happens, so the institutional knowledge that used to live in one engineer's head starts living somewhere durable instead. Audit trails replace the after-the-fact war-room reconstruction, since every action gets logged and timestamped as it happens.
The Google SRE Book sets a target of keeping toil below 50% of an engineer's time, and the Google SRE Workbook targets no more than two incidents per on-call shift. For most teams, those targets have functioned as aspiration: something quoted in a retro and then quietly ignored the next sprint. Automated diagnosis is the mechanism that makes them achievable, because it changes what "handling an incident" actually requires from the human on shift. The healthy end state looks like a reviewed fix PR landing quickly, without a Slack thread of forty replies and three people pulling logs in parallel.
Why agentic development raises the stakes for automated diagnosis specifically
AI coding tool adoption has reached very high levels, with multiple major 2025–2026 surveys placing it between 84% and 91%. Trust hasn't kept pace; Stack Overflow found trust in AI accuracy dropped to 29%, down 11 percentage points from the prior year. Developers are shipping more AI-generated code while trusting it less, and that combination should worry anyone running production systems, because the two trend lines are moving in opposite directions at once.
The consequence for diagnosis is direct. AI-generated code ships in higher volume and at higher speed than human-written code typically has, which shrinks the window between deploy and incident and grows the pool of potential regressions sitting in production at any given moment. Agentic systems raise the stakes further because they act rather than merely suggest, often inside systems nobody has fully mapped. The 2025 AI Agent Index found sandboxing or VM isolation documented for only 9 of 30 agents surveyed. Most of what's running today has an unclear blast radius by design, not by accident.
Human code review cannot catch every regression when code arrives at agent speed and agent volume; the review step was never built for that throughput. Production verification against real telemetry becomes the necessary second check, because CI can pass cleanly on AI-generated code that behaves nothing like its test run once it meets real traffic patterns. Live telemetry alone reveals that gap, and only automated diagnosis catches it fast enough to matter.
What teams need in place before automated diagnosis can run
Automated diagnosis is only as good as the telemetry feeding it. A service with inconsistent logging, missing traces, or gaps in metrics emits no usable signal, no matter how sophisticated the correlation engine sitting on top of it is. Observability has to shift left: consistent instrumentation checked in code review, observability checks built into CI/CD, features shipped with their metrics and traces already defined instead of bolted on after the first incident.
Deployment event linkage matters just as much. The system needs a clear signal for when a deploy happened and what changed inside it; without that signal from the pipeline, change-event correlation turns into guesswork wearing an automation costume. Dynamic baselines need time too, since telling a genuine regression apart from normal variation requires a stable collection period before the thresholds mean anything at all.
Autonomy has to be scoped on purpose, not backed into after something breaks. Pre-approved, low-risk tasks can run without a human in the loop; anything with broader potential impact needs a gate a person has to clear. A complete audit trail isn't optional here, and permissions and guardrails need to get built at design time. Retrofitting them after an incident, once autonomous actions have already touched production, costs far more than building them in from the start.
Measuring whether automated diagnosis is actually working
A handful of metrics tell the real story, and none of them are vanity numbers. Time to triage, the interval between an alert firing and a root cause hypothesis landing in a responder's hands, is the most direct read on diagnostic compression. Alert actionability rate, the share of pages resulting in real action, should sit in the 30-50% range for a healthy system. The share of incidents resolved without a human page at all is a leading indicator that toil is actually going down rather than just changing shape. MTTR broken out by deploy cohort, comparing incidents triggered by recent deploys against ambient failures, shows whether post-deploy verification is earning its keep or just adding another dashboard nobody checks.
The DORA elite benchmark of sub-hour MTTR stops being an outlier reserved for a handful of exceptional teams once the diagnostic phase gets compressed, not just the detection or deployment phases around it. The financial case follows directly: at $15,000 per minute of downtime, per Splunk and Cisco's Hidden Costs of Downtime 2026 figures, shaving 20 minutes off diagnosis on a major incident carries a dollar value that's easy to calculate and hard to argue with.
Merging a pull request and verifying it works in production are two separate events, and the gap between them is where most of the diagnostic gap comes from in the first place. Automated diagnosis closes that gap at the pace modern delivery now demands.