How to Calculate MTTR for Engineering Teams
Define your clock's start, stop, and what counts as recovered.

MTTR, mean time to recovery, is arithmetic that a spreadsheet can handle in one column: total downtime divided by number of incidents. The number itself is trivial to produce. What determines whether that number means anything is a set of definitional choices most teams never write down: when the clock starts, when it stops, and what counts as "recovered" in between. Two organizations can suffer the identical outage, staff it with equally skilled engineers, and report MTTRs that differ by an order of magnitude, simply because one team started the clock at detection and the other started it at acknowledgment. That gap is not noise. It is the difference between a metric that tells you where engineering time is actually being lost and one that tells you nothing at all.
What MTTR actually measures, and what it does not
MTTR, in its standard form, measures the average elapsed time from the moment an incident is detected to the moment the affected service is fully restored. The word "recovery" is doing real work in that sentence: it means restored, not mitigated, not handed off to a follow-up ticket, not "probably fine now." A service that is degraded but stable does not count as recovered under a rigorous definition, even if the on-call engineer has stopped actively working the page.
Just as important is what MTTR was never built to capture. It says nothing about how often failures happen, that's a separate metric, mean time between failures, and nothing about how long the system ran cleanly before this incident started. By itself, it also says nothing about cause: whether the outage traced back to a bad deploy, a third-party API going dark, or a hardware failure in a data center, unless the team has explicitly scoped its definition to include or exclude those categories.
DORA's 2023 decision to rename the metric "Failed Deployment Recovery Time" makes this scoping problem concrete. By narrowing the definition to failures triggered specifically by a software change, DORA turned a fuzzy, catch-all number into something delivery teams could actually act on, and made it less vulnerable to being dragged around by incidents that had nothing to do with the code they shipped. Teams adopting MTTR should make the same choice explicitly, upfront: is this measuring every production incident, or only the ones caused by a change? Both scopes are defensible. Mixing them, tracking change-induced failures and infrastructure failures and third-party outages under one undifferentiated number, produces a metric that answers neither question cleanly.
The five phases hiding inside a single MTTR clock
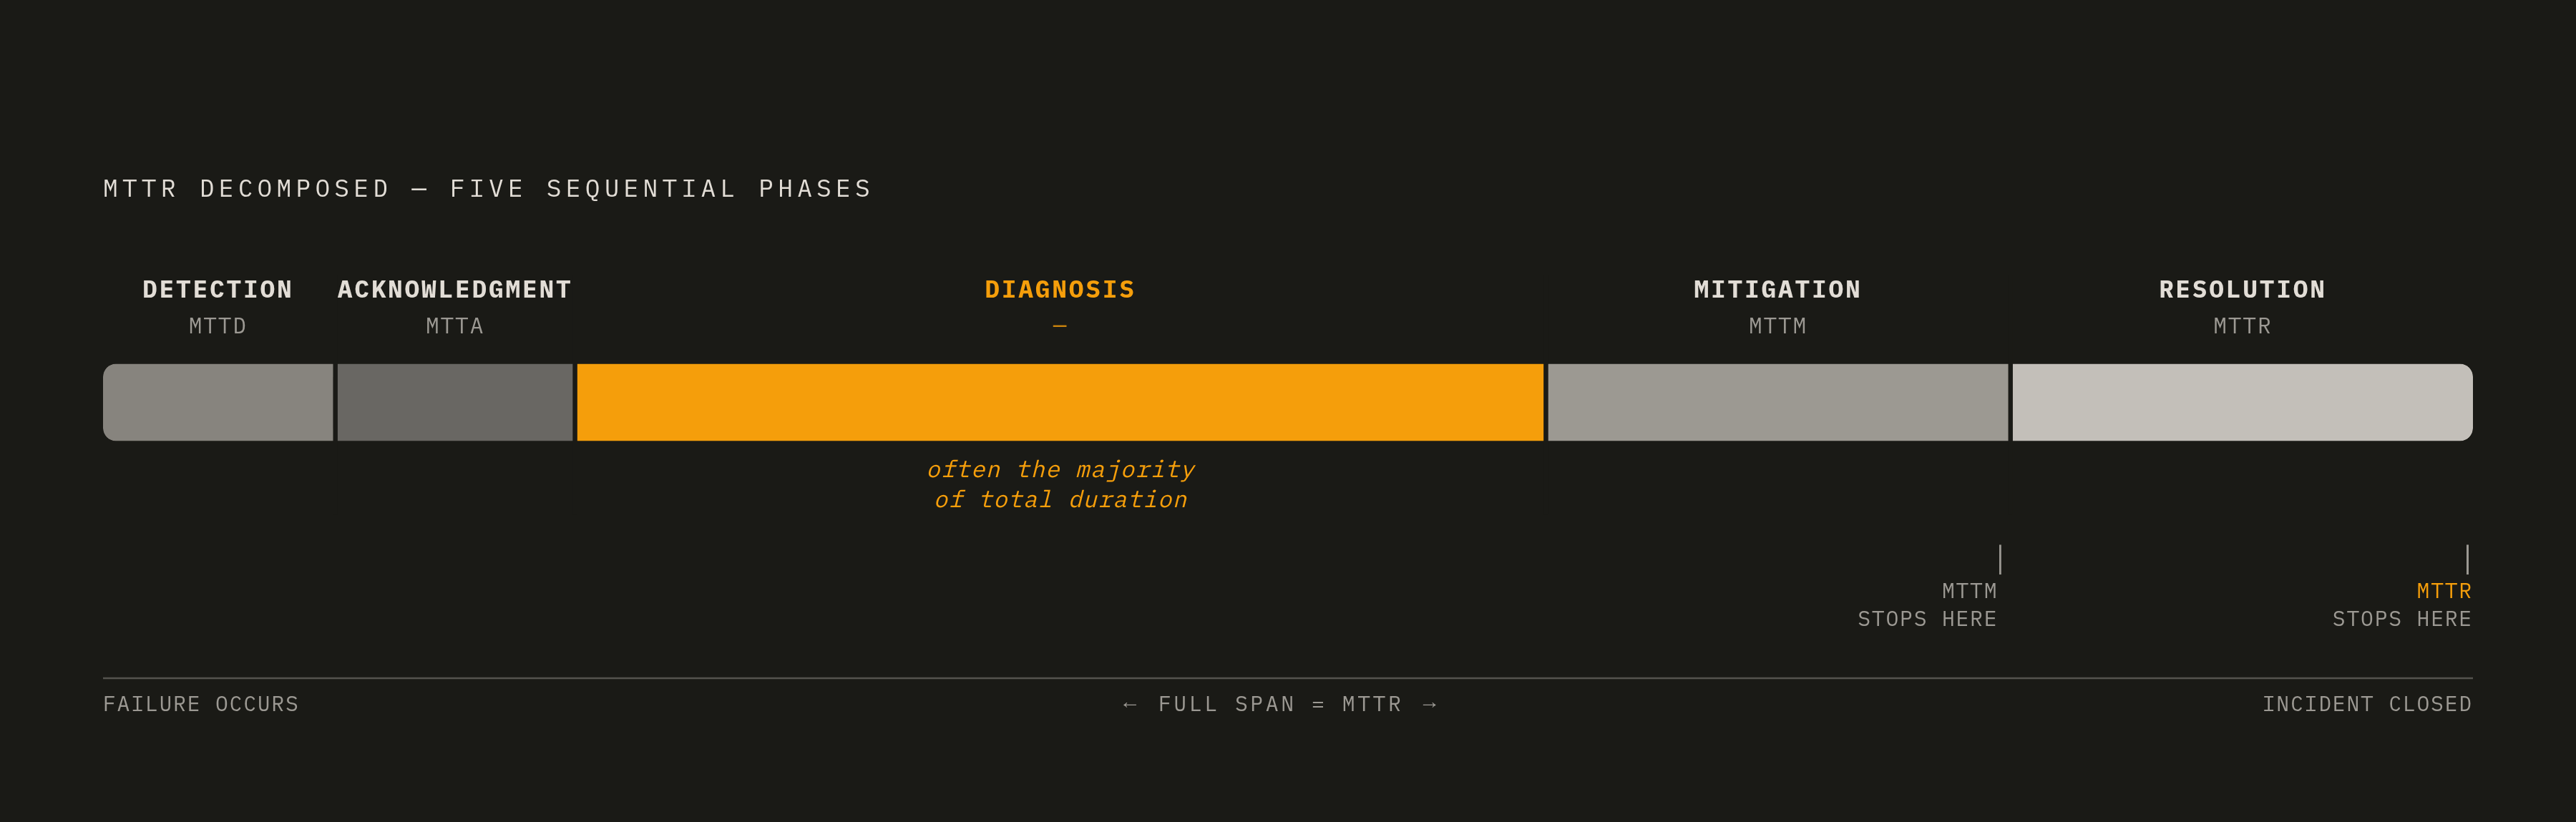
A single MTTR figure is really a compression of at least five separate clocks, each measuring a distinct phase of incident response, each worth tracking on its own.
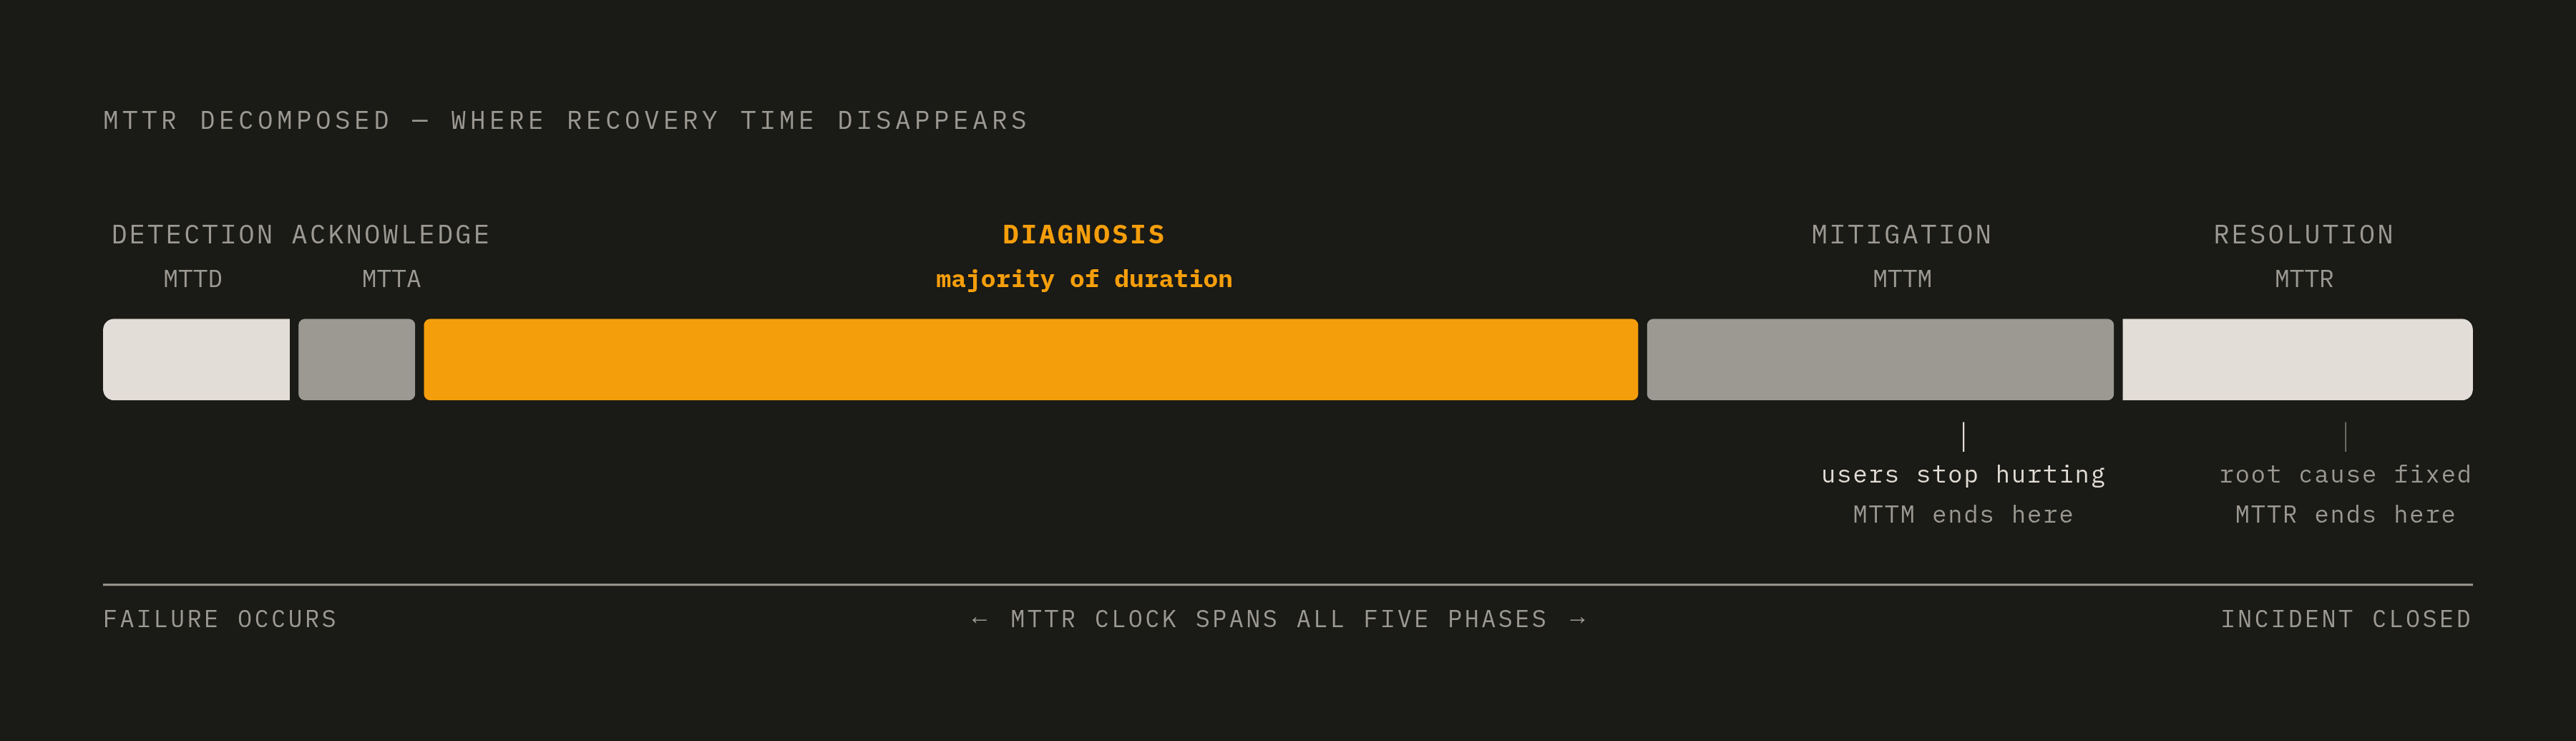
Detection, sometimes called MTTD, runs from the moment failure actually occurs to the moment the team becomes aware of it. Acknowledgment, MTTA, runs from the alert firing to a responder confirming they're on it. Diagnosis picks up from there and runs until the team understands the root cause well enough to attempt a fix. Mitigation, MTTM, covers the span from diagnosis to the point where customer impact stops, even if the underlying problem hasn't been fully addressed. Resolution, the final phase, runs from mitigation to full restoration and formal incident closure.
Diagnosis is almost always the phase that eats the most time, often the majority of an incident's total duration, and it's also the phase that gets the least individual visibility, because it sits buried inside a single MTTR number that nobody has bothered to break apart.
The sharpest fork in this whole framework sits between MTTM and MTTR. MTTM stops the clock the moment users stop feeling the pain: a rollback completes, a circuit breaker trips, traffic reroutes away from the failing node. MTTR, properly defined, keeps running until the root cause is addressed and the system is confirmed healthy again. Conflate the two, and recovery looks faster than it is. Incidents closed at the mitigation point have a habit of reopening, because whatever caused the failure is often still sitting there, unaddressed, waiting for the next trigger. A team tracking each phase separately can see precisely where its process bogs down. A team tracking only the composite number is flying blind by design.
Where teams draw their clocks incorrectly
The single most common error is starting the clock at alert acknowledgment instead of at actual failure onset. This quietly erases detection time from the metric altogether, which flatters the team's numbers while hiding a real problem: if failures aren't detected quickly, the fact that they're acknowledged quickly once someone finally notices is a much smaller accomplishment than it looks.
A close second: stopping the clock at mitigation and calling it recovery. As covered above, incidents closed this way can resurface, and when they do, they often get logged as a fresh incident rather than a continuation, which further distorts the historical trend.
Including phases that have nothing to do with engineering effort, waiting on stakeholder sign-off, scheduled maintenance windows, a weekend on-call handoff that sat idle for six hours, inflates MTTR in ways that misrepresent actual technical performance. None of that time reflects how fast engineers can diagnose and fix a problem; it reflects organizational friction, and it should be tracked separately if it's tracked at all.
Then there's the detection blind spot, which is structural rather than a simple mistake. When a team learns about a failure from users complaining rather than from its own monitoring, the real MTTD for that incident is effectively invisible. It never entered the data, because nothing logged the moment the failure actually began. Research across IT organizations has repeatedly found that a large share of production problems surface this way, through users, not tooling, which means a lot of teams are systematically under-reporting how long problems go undetected.
Outliers compound the distortion. A single catastrophic incident, a multi-day database corruption event, a cascading failure across dependent services, can drag a monthly mean far above what a typical incident actually looks like. When that happens, the mean stops describing anything real about the distribution. The fix is simple enough: track the median alongside the mean, and flag any incident that blows past some reasonable multiple of the median as its own category rather than folding it silently into the average.
How to set up the calculation so the number is comparable over time
Before touching any data, agree on incident scope. All production incidents, or only the change-induced ones? User-reported problems in or out? Write the answer down, version-control it the way engineering teams version-control everything else that matters, because if the scope quietly shifts halfway through a quarter, the trend line breaks and nobody notices until leadership asks why MTTR "improved" for no discernible reason.
Next, fix the canonical start and stop events for the clock. The clock should start at whichever comes first: the first alert firing, or the earliest confirmed evidence of customer impact. It should stop only at verified restoration, meaning telemetry confirms normal behavior, not "a fix was deployed and everyone went home."
Record each phase separately in the incident log rather than collapsing everything into one duration field. Apply the formula over a consistent window, a rolling 30 days is common practice, and ideally one that lines up with existing SLO reporting periods so the numbers can be read side by side. Report mean and median together every time, and call out any outlier incidents distorting the average rather than letting them hide inside it.
Tooling has made this cheaper than it used to be. GitHub and GitLab both now ship DORA dashboards that surface MTTR alongside deployment frequency and change failure rate out of the box, which has cut down the setup cost that used to turn consistent tracking into a multi-week internal project. None of this precision is for its own sake. The entire point of the exercise is comparability: next month's number needs to measure the same thing this month's did, or the comparison is meaningless.
What DORA's performance tiers actually tell teams about their baseline
DORA's framework sorts teams into performance tiers by recovery time: elite performers resolve incidents in under an hour, high performers within a day, medium performers somewhere between one day and one week. Useful as orientation. Dangerous as a target.
A team can climb into the "elite" tier on paper simply by narrowing its own clock definition, measuring only the easy incidents, or stopping the clock at mitigation instead of full recovery, without improving actual recovery capability by a single minute. The tier system rewards the definition, not necessarily the performance behind it.
DORA's more durable finding sits elsewhere: speed and stability are not opposing forces for high-performing teams. Elite teams post strong numbers on recovery time and on change failure rate at the same time, which suggests that investment in reliability compounds rather than competes with velocity. That's a meaningful data point about how engineering organizations actually work. But the benchmark only becomes useful once the definitional groundwork from the earlier sections is done: compare a team against its own history first, consistently defined, before ever reaching for an industry-wide figure. DORA's 2024 expansion to five metrics, adding Deployment Rework Rate to the original four, reinforces the same point from a different angle: recovery speed alone was never a complete picture of deployment health, and DORA's own framework has acknowledged as much.
Why diagnosis is where most recovery time actually goes
Detection and acknowledgment move fast when alerting is well-tuned. Diagnosis is the phase that consistently swallows the bulk of an incident's duration, and it does so for structural reasons that have little to do with individual engineer skill.
Logs, metrics, traces, and deployment history typically live in separate tools, which means engineers lose time simply switching context between systems instead of reasoning about the actual problem in front of them. Sampling gaps in distributed tracing mean the one request that would explain everything frequently has no trace at all. Alert noise during the incident itself makes it harder to tell genuine signal from cascade effects rippling out from the original failure.
Tool sprawl is a direct, measurable contributor to MTTR: every extra context switch during an active outage is time the SLO is burning, whether or not it shows up as a distinct line item anywhere. Slow acknowledgment, alerts sitting unread, gaps in the on-call rotation, adds to MTTA before diagnosis has even started, and it's worth tracking as a separate signal, because it points to a process failure rather than a technical one.
Remediation itself is increasingly automated in rollback scenarios; automated pipelines can push a fix in minutes once the diagnosis is done. That's exactly why verification after the fix has become the new place teams lose time. Confirming a deploy succeeded is not the same as confirming the service is actually healthy again, and that gap deserves its own section.
How alert noise inflates MTTR independently of the incident itself
Alert fatigue is a measurement problem before it's an operations problem. When responders start suppressing or delaying their reaction to alerts, the detection and acknowledgment phases lengthen quietly, without anyone deciding that should happen.
The mechanism is straightforward desensitization: an engineer who has dismissed dozens of false positives over the past month takes longer to treat the next alert as genuinely urgent, even when it is. Research across production environments consistently finds that the large majority of alerts require no immediate action at all, meaning the noise-to-signal ratio most teams operate under is badly inverted.
Static threshold alerts are the primary offender here. A fixed threshold cannot tell the difference between a routine Tuesday-morning traffic spike and a genuine anomaly, so it fires on both, and the responder learns to distrust it accordingly. Adaptive baselines, thresholds that adjust to observed traffic patterns rather than sitting fixed, produce fewer alerts and make the ones that do fire more trustworthy. That directly compresses MTTA, because it reduces how much classification work falls on the responder before they even start investigating.
Intelligent routing is the other lever worth pulling: pages that go straight to the team that owns the affected service, with automatic escalation if nobody acknowledges within a set window. Misdirected alerts add handoff time before diagnosis has even begun, and that handoff time is entirely avoidable. Teams serious about this should track signal-to-noise ratio as a leading indicator in its own right; a ratio that's deteriorating predicts MTTR increases before they ever show up in the incident data itself.
The role of production verification in closing the clock honestly
The most underappreciated mistake in MTTR calculation doesn't happen in detection or diagnosis. It happens at closure, when teams stop the clock the moment a fix deploys rather than the moment telemetry confirms the fix actually worked.
A CI pipeline going green is a necessary signal. It is not a sufficient one. Staging and pre-production environments cannot replicate real traffic patterns, real data distributions, or the actual behavior of live dependencies under load, no matter how carefully they're built. The gap between "deploy succeeded" and "service is healthy" is exactly where incidents reopen, and when they reopen, they often get logged as new incidents rather than continuations of the old one, which makes the trend line look worse than the underlying reality and obscures the real culprit: verification was skipped.
Real verification means checking live telemetry after every deploy, not just watching the pipeline finish. Error rates, latency distributions, and throughput all need to be compared against a pre-deploy baseline, and ideally that comparison runs through automated checks that confirm no regression before the incident gets marked closed. Teams that build this into their workflow stop the clock at a moment that's actually true, and they catch the cases where the first fix didn't fully hold before a customer does. Platforms like OnePatch sit in that exact gap between pull request and production, automatically checking each deploy against live telemetry and opening a fix PR the moment something breaks, turning verification from a step an exhausted engineer has to remember at 2 a.m. into a structural part of the pipeline itself.
How AI fits into the calculation and the workflow without distorting either
AI's most defensible contribution to MTTR sits squarely in the diagnosis phase, where it can correlate logs, metrics, traces, and deployment history in parallel instead of forcing an engineer to work through them one tool at a time. In practice, that looks like a system surfacing the most probable root cause along with supporting evidence, suggesting a specific rollback command or configuration change, and recalling similar incidents from history, compressing the investigative work that otherwise consumes most of an incident's total duration.
There's a real caveat attached to this, though. Incidents involving AI-generated code can take longer to diagnose, not shorter, because a responder first has to reconstruct what the code was supposed to do before they can figure out why it's misbehaving. Case studies from enterprise environments in 2024 found remediation for AI-generated logic taking materially longer than for equivalent human-written code, which cuts directly against the assumption that more AI in the pipeline automatically means faster recovery.
The sharper risk shows up with agentic systems, AI given the authority to take autonomous remediation action: rolling restarts, configuration changes, traffic shifts. A fast, wrong automated response can extend an incident rather than close it, and speed without accuracy is not progress, it's a new failure mode wearing the costume of one.
The guardrails are not complicated. Require human approval for any action with a production-side blast radius, database restarts, traffic rerouting, anything that touches customer-facing state directly. Measure automation accuracy alongside MTTR, not instead of it, because a fast wrong answer is categorically worse than a slow correct one. And start automating the low-risk, high-frequency work first, spinning up incident channels, paging the right on-call rotation, updating a status page, well before handing diagnosis or remediation itself over to a model. NIST SP 800-61 Revision 3, published in 2025, explicitly endorses automating alert handling, triage, and information sharing, which gives teams a real compliance framework to point to when they need to justify these investments to a security or audit function.
Turning MTTR into a number the team can actually act on
MTTR earns its keep only when it's stable enough to trend: same definition, same clock boundaries, same incident scope, tracked month over month without the ground shifting underneath it.
Before reporting any MTTR figure, a team should be able to answer a short set of questions honestly. Does the clock start at actual failure onset, or does it start at alert acknowledgment, quietly erasing detection time? Does it stop at mitigation, or at verified restoration confirmed by real telemetry? Are change-induced incidents kept separate from externally caused ones, or are they blended into a single number that explains neither? Is a long-tail outlier dragging the mean upward, and if so, is the median being reported alongside it so the distortion is visible rather than hidden? And are the sub-phase durations, detection, acknowledgment, diagnosis, mitigation, logged individually, so the team can see exactly where its time is actually going rather than guessing from a composite figure?
Once those answers exist, the number stops being a scoreboard and starts being a diagnostic tool. A high MTTR with slow diagnosis points toward tool sprawl and fragmented telemetry. A high MTTR with slow acknowledgment points toward alert fatigue and routing failures. A high MTTR with fast mitigation but incidents that keep reopening points toward a team that has been measuring mitigation and calling it recovery all along. The arithmetic was never the hard part. Knowing what the clock is actually counting always was.