Multivariate Anomaly Detection Across Service Telemetry
Catch cascade failures by correlating signals across services, not monitoring each one alone.

Microservice systems throw off a staggering amount of telemetry, and almost none of it looks wrong until the moment a user notices something broke. That gap, between individually normal signals and a system that's actually failing, is the entire problem multivariate anomaly detection exists to solve. Most teams get the fix backwards: they add another dashboard instead of asking whether they're even watching the right unit of data.
Service boundaries chop context into pieces. A latency bump in the checkout service, a slow memory creep in the inventory service, a rising error rate in the payments log: each one sits comfortably inside its normal range. Put them together, though, and the picture changes completely. That combination is often the earliest visible sign of a cascading failure, and no single dashboard catches it, because no single dashboard looks at more than one signal at a time.
Traditional logging and isolated metrics were never built to hold distributed context together. That's a structural limit, not a tooling gap you patch by buying another tool, and single-variate alerting at scale guarantees one of two outcomes: alert fatigue or missed failures. There isn't a third option. Any team still treating threshold alerts as a serious strategy has already picked the losing one.
What "multivariate" actually means in the context of service telemetry
Multivariate time series anomaly detection, MTSAD for short, asks a system to track two things at once: how a signal behaves over time, and how it behaves relative to every other signal around it. Miss either dimension and the model is only half looking.
Distributed systems throw off three kinds of telemetry, and each one captures something different. Metrics are the numbers: CPU, memory, request rate, latency percentiles, sampled on a clock. Logs are events: errors, state changes, the record of what happened, arriving whenever they arrive, with no fixed rhythm. Traces stitch together the path a single request takes as it hops from service to service, giving you the connective tissue metrics and logs don't capture on their own.
These three don't line up naturally. Processing delays, network delays, asynchronous calls: all of it means a log entry and the metric sample describing the same real-world event can land in different time windows. The FFAD paper names this asynchrony as a core obstacle. The standard workaround, batching logs and metrics into coarse windows and treating whatever falls inside the same window as related, doesn't model the actual relationship between events. It just assumes proximity means correlation, and that assumption is often wrong.
None of the three modalities on its own tells the full story, and the FFAD research is blunt about it: multi-modal fusion isn't a nice-to-have, it's required to catch the range of anomalies that show up in production. The deeper issue isn't a shortage of data, since most teams already collect plenty of it. The issue is analyzing that data in the wrong unit, one signal at a time, instead of the unit that actually matters: correlated patterns across signals, over time.
How correlation between signals reveals what individual thresholds miss
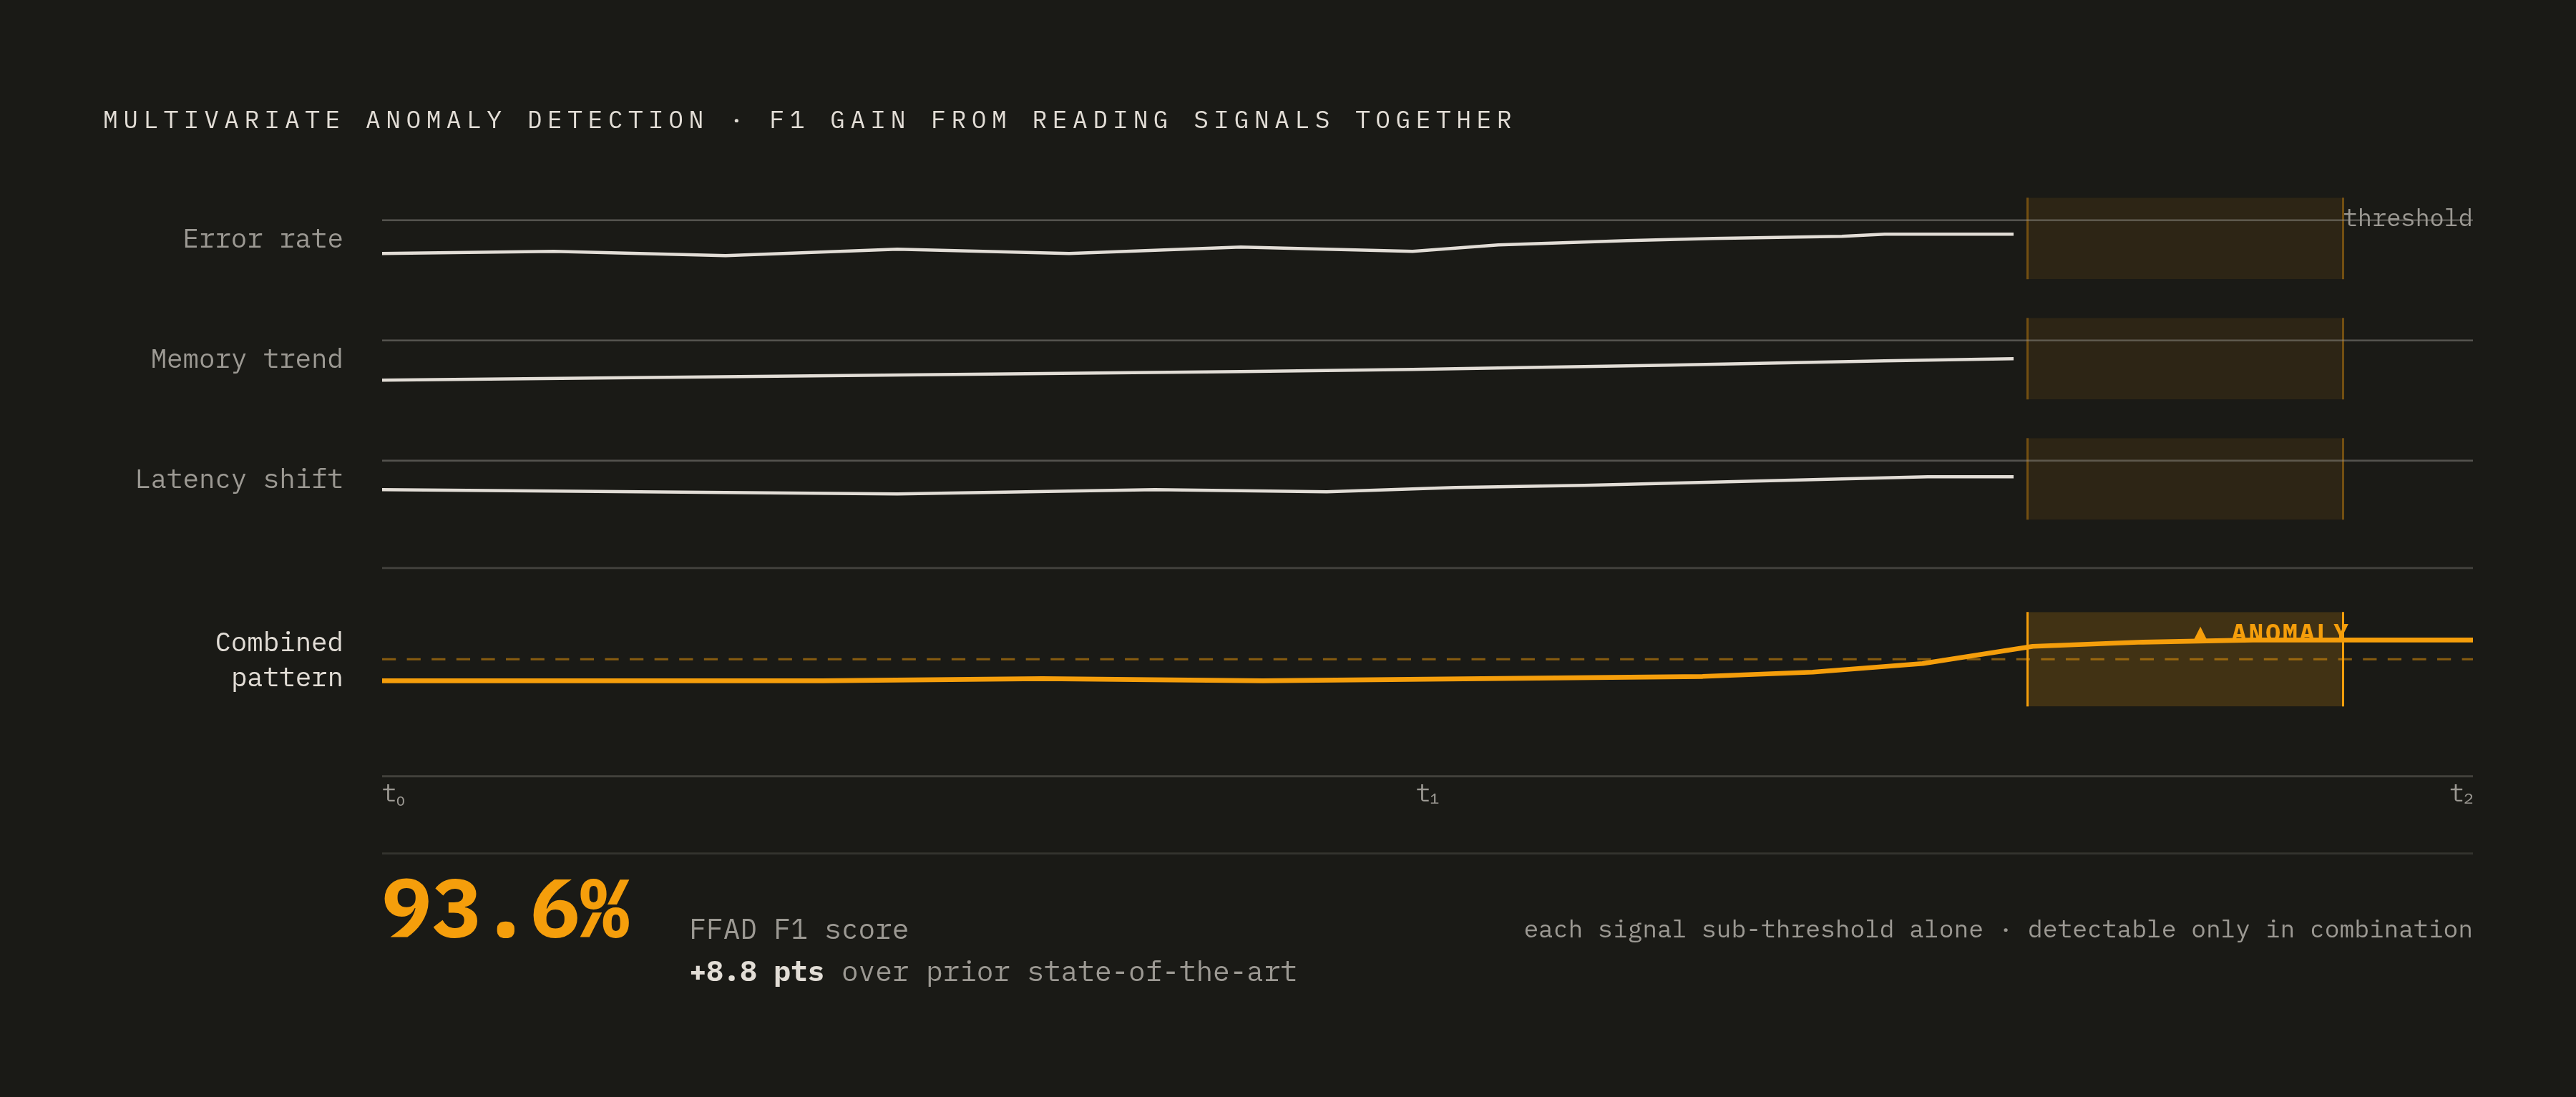
Static thresholds have a specific failure mode in cloud-native environments: they can't tell the difference between a real problem and a system that's just doing its job. Autoscaling pushes CPU past 90% all the time, and that's not an incident, that's Tuesday. Anyone who's tuned a threshold alert for a bursty autoscaling group knows the drill: set it too tight and it screams all day, set it loose and it misses the thing it was built to catch.
The pattern that breaks single-variate alerting is subtler than a missed threshold. Every individual signal can sit under its limit while the combination, a slightly elevated error rate plus a slow memory trend plus a small latency shift, is the actual anomaly. None of the three pieces alone would trigger anything.
MtsCID, published at WWW '25 in Sydney in April 2025 (arXiv:2501.16364), found something worth sitting with: methods chasing overly fine-grained detail actually missed the salient temporal and inter-variate patterns they were built to catch. Modeling both dimensions, time and cross-signal relationship, at a coarser grain together outperformed or matched state-of-the-art approaches across seven benchmark datasets. Past a certain point, more granularity works against you, not for you.
The FFAD method, presented at the WWW '25 Companion proceedings in Sydney (April 28 to May 2, 2025), attached a number to the improvement: graph-based alignment of logs and metrics hit an average F1-score of 93.6%, an 8.8-point gain over previous state-of-the-art methods. That 8.8 points isn't a benchmark trophy. It stands for failures that would have stayed invisible under threshold-based or coarse multi-modal methods, caught early instead, before they spread. Earlier detection means a smaller blast radius, full stop.
Correlating signals also kills three specific flavors of alert noise: false positives from normal behavior that only looks strange in isolation, duplicate notifications for one underlying issue firing across several single-signal monitors, and over-sensitive triggers for minor blips with no matching signature anywhere else in the system.
The model architectures doing this work in 2025 and what they actually model
Graph-based approaches are where most of the 2024 to 2025 research energy has gone, for a specific reason: microservice systems already have a natural graph structure, the service dependency graph, and that structure is exactly what you need to model correlations between services.
GAL-MAD (arXiv:2504.00058, April 2025) combines Graph Attention networks with LSTM layers. The graph attention piece captures which services are related, and the LSTM piece captures how their signals move together over time. It also produces SHAP values, which matters more than it sounds: instead of a bare anomaly score, the output points to a specific service and a specific likely cause. That distinction, an alert versus a lead, is the one most vendor pitches skip past.
Alongside GAL-MAD came RS-Anomic, a dataset built from the RobotShop microservice application, covering ten distinct anomaly types across roughly 100,000 normal data points and 14,000 anomalous ones. That gives the field a shared, rigorous baseline built for microservice telemetry, rather than adapted from some other domain.
A separate approach builds Directed Acyclic Graphs straight from service traces, runs Graph Convolutional Networks over them for structural embeddings, then applies LSTM Autoencoders to model aligned CPU and memory sequences per service. It aims squarely at span-level detection, an area where visibility has historically been thin.
MSTGAD takes yet another angle. It builds a microservice system twin, a graph where nodes are service instances and edges are scheduling relationships, then runs a model with both spatial and temporal awareness over it. The finding echoes across all three approaches: modeling correlation between data types and time dependency within each type both improve detection, and they improve it together, not separately.
None of these three treats service topology as background scenery. The relationships between services are part of the signal itself, not context surrounding the metrics. And the SHAP-based localization in GAL-MAD points at something practical: explainability here isn't academic polish, it's the difference between "anomaly detected" and "anomaly in service X, likely caused by Y," which is the difference between an alert and a starting point for a fix.
Why these methods still struggle at deploy time without production telemetry as the anchor
Span-level detection, despite the research progress above, still isn't solved in production. Fragmented metrics and limited context at the span level remain live constraints, not problems anyone's closed out.
Deploy time exposes a specific blind spot. Most anomaly detection trains against steady-state behavior, and a new deployment changes what "normal" means overnight. A model trained on yesterday's baseline can misread today's genuinely normal post-deploy behavior as anomalous, or, worse, quietly absorb a degraded new normal as fine.
Canary deployments are supposed to manage that risk, but they bring their own observability demands. Doing canary rollout right means watching the stable version and the canary version at the same time, comparing full multivariate signal profiles between them, not just checking whether either one trips a threshold.
That's exactly where canary goes wrong for teams that adopt it as a checkbox instead of a discipline. Without strong multivariate visibility, canary results turn noisy or flat-out misleading. A team that doesn't have the monitoring in place to catch that shift, or a system that wasn't built for controlled traffic splitting in the first place, has no business treating canary as the default rollout strategy. That's a prerequisite conversation most post-deploy retros skip entirely, and skipping it is why canary gets blamed for failures that were really a monitoring gap wearing a canary costume.
CI passing tells you the build compiles and the tests pass. It says nothing about how the service behaves against real traffic, real downstream dependencies, and the failure modes that never showed up in a test fixture. Production telemetry is the only ground truth there is. Treating a green CI run as equivalent to a healthy deploy is the mistake that keeps span-level blind spots alive.
How alert correlation turns multivariate detection into actionable incident response
A correlated anomaly that fires as a single incident, related signals grouped together so one root problem produces one ticket, is a different animal entirely from three separate threshold alerts that each need their own investigation.
Applied to multivariate output, the AIOps incident lifecycle breaks into three moves. Detection identifies the correlated pattern itself, not a single threshold breach. Triage groups and summarizes automatically, routing the incident to whichever team the correlated signals point toward. Resolution runs an automated runbook off the root-cause classification, instead of waiting on a human to diagnose from scratch.
The TrioXpert case study (arXiv:2506.10043) shows this working end to end. Logs, metrics, and traces are handled together through a collaborative LLM reasoning process that performs anomaly detection, fault triage, and root-cause localization simultaneously, producing a single diagnosis across three signal types.
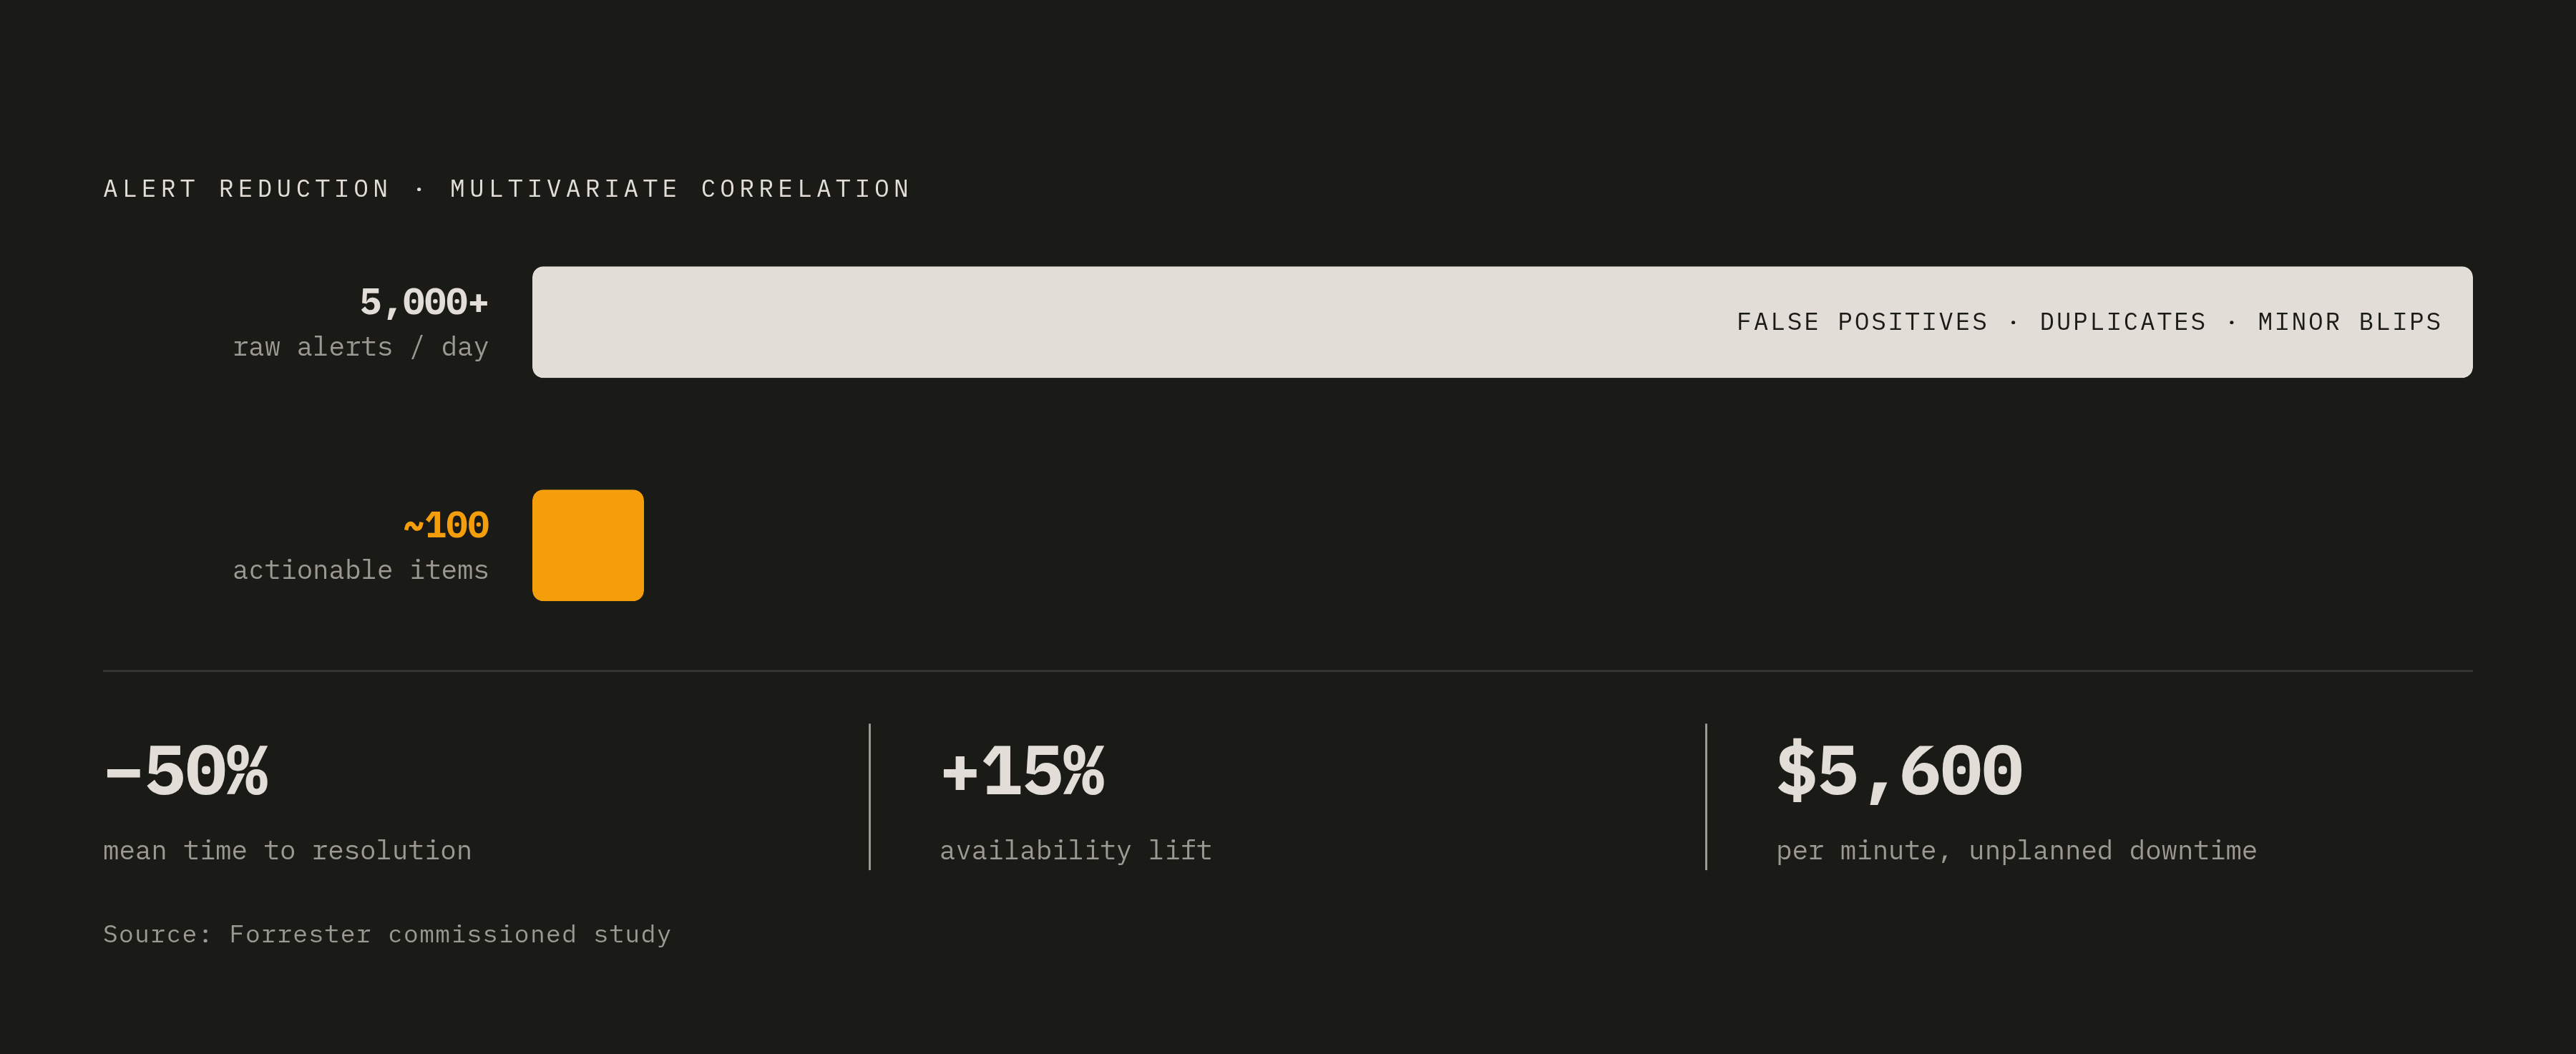
Organizations running this kind of correlation report daily alert counts falling from over 5,000 down to around 100 items that actually need a human to act on. Nothing about the underlying system got quieter. What changed is that correlated grouping stripped out the redundant and false-positive noise sitting on top of the real signal.
A Forrester-commissioned study found that pairing AI observability with automated correlation cut mean time to resolution by up to 50%, alongside a 15% lift in availability for revenue-generating applications. Unplanned downtime runs an estimated $5,600 a minute, so MTTR isn't just an engineering scoreboard number, it's a revenue line. The distance between 5,000 alerts and 100 actionable ones is the same distance between an on-call engineer who can respond and one who's underwater.
What agentic development adds to the multivariate detection problem
Analysts widely expect task-specific AI agents to be embedded in a growing share of enterprise applications within the next few years. Production baselines are shifting faster than detection infrastructure is keeping pace with, and that mismatch is the story here, not the agents themselves.
AI coding agents bring their own version of the problem. Researchers have flagged that AI-generated code suggestions can carry security vulnerabilities, and once agents ship code continuously, the production baseline stops being a fixed thing to detect deviations against and becomes a moving target.
Governance hasn't caught up, and pretending otherwise is wishful thinking. Across the frontier-level autonomous agents active today, safety evaluation disclosures remain sparse.
That gap is exactly why multivariate detection matters more, not less, as agents take on more of the deploy pipeline. A subtle bug an agent ships may never cross a single threshold, either because the regression is too small or because the threshold was calibrated for a human deploy cadence, not a continuous one. A small latency increase paired with an error rate shift and a memory trend, though, is precisely the kind of correlated signature an agent-introduced regression leaves before it turns into an actual outage. Production telemetry becomes the control plane that makes autonomous behavior auditable: what got deployed, what changed in the signals afterward, and whether that correlated shift warranted a rollback.
NIST's AI Agent Standards Initiative, launched in February 2026, names agent security and identity as core pillars, and that's a signal in itself: observability infrastructure tracking agent actions against production telemetry is moving from good practice toward regulatory expectation. OpenTelemetry-compliant instrumentation, logging prompts, tool calls, and agent decision paths right alongside standard service telemetry, puts teams in a position to feed both streams into the same multivariate detection layer instead of treating agent behavior as its own separate silo.
What teams need in place before multivariate detection delivers on its promise
None of this works without a telemetry foundation underneath it. Clean instrumentation, working CI/CD, real observability infrastructure, self-service platform capability: all of that has to exist before a detection layer, however sophisticated, adds anything. No model compensates for missing or fragmented data. Teams that skip straight to buying a detection product before fixing instrumentation are buying a report card for a class they haven't attended.
Three specific instrumentation gaps break multivariate detection in the field. Incomplete trace coverage leaves graph-based models with no edges to learn from wherever spans don't cross a service boundary. Metric and log asynchrony, left unaligned, reproduces the same correlation errors FFAD was built to fix, and teams still running coarse-grained window alignment often get worse results from multi-modal fusion than they'd get from metrics alone. Baseline instability at deploy time means a model trained on pre-deploy behavior needs some way to re-anchor after each release, or the first few hours post-deploy turn into a flood of false positives.
Alert correlation and noise reduction is the sensible place to start, not the most ambitious one. Read-only analysis of correlated signals is low-risk and well-bounded as a first workload: the value shows up fast, the downside is small, and the team gets a chance to see whether the system's reasoning holds up before anyone hands it authority to remediate anything on its own.
Tool sprawl works directly against all of this. Organizations running multiple fragmented monitoring tools aren't set up to do multivariate detection at all, no matter how good the underlying model is, because every extra dashboard an engineer opens mid-incident is time the SLO clock keeps running. Trying to correlate signals across separate tools by hand erases whatever advantage correlation was supposed to buy.
Adoption of AI-powered monitoring rose from 42% to 54% between 2024 and 2025, inside an AIOps market valued at $11.16 billion in 2025 and growing at a 25.3% compound annual rate. But having AI monitoring installed and having it configured for genuine multivariate correlation are two different states, and that gap is where most teams are currently stuck.
Production verification as a first-class step means each deployment is validated against real production telemetry, not because CI falls short at what it does, but because the correlated signal pattern in production is the only place the real failure modes show up. Automated verification that triggers a response the moment correlated signals shift is what closes the space between merging code and actually knowing whether it worked.
Sources
- Multivariate Time Series Anomaly Detection by Capturing Coarse-Grained Intra- and Inter-Variate Dependencies
- Enhancing Web Service Anomaly Detection via Fine-grained Multi-modal Association and Frequency Domain Analysis
- A Survey of Deep Anomaly Detection in Multivariate Time Series: Taxonomy, Applications, and Directions | MDPI
- MADM: Microservice Anomaly Detection Based on Multi-source Data | Springer Nature Link
- link.springer.com