How to Instrument Regression Detection Into a Deployment Pipeline
Catch performance regressions automatically in your pipeline, not hours later in production.
A deployment pipeline that only checks code before it ships is checking the wrong half of the problem. Regressions that matter, the ones that hurt users and burn engineering time, mostly show up after the merge: under real traffic, real data volumes, and real dependency behavior that no test suite reproduces in CI. The 2025 DORA State of AI-Assisted Software Development report, run by Google Cloud with roughly 5,000 respondents, found only 8.5% of teams hitting elite change failure rates of 0 to 2%, while 39.5% are still above 16%. That gap is not closing by adding more pre-merge tests. It closes by wiring regression detection into the pipeline itself, as a set of stages that run after the gate opens, not as a monitoring workflow bolted on hours later.
What pipeline-native regression detection actually means
Three things get lumped together that shouldn't be: pre-deploy testing, deployment verification, and post-deploy observability. Each does a different job, and none can stand in for the other two. Pre-deploy testing checks that the code does what it's supposed to do in isolation. Deployment verification checks that the new build behaves the way the last known-good build behaved, once it's live. Observability is what feeds that comparison with actual signal instead of guesswork.
Pipeline-native means the second and third of those happen as pipeline stages, generating and comparing signals automatically, rather than waiting for a human to notice something looks off in a dashboard. Two things have to exist for that to work. First, a baseline: a known-good snapshot of system behavior that every new build gets checked against. Second, a comparison gate: an automated decision point that blocks promotion, or triggers a rollback, when the new build strays too far from that baseline.
Proving a build performs well consistently, not just once, matters before moving on. It's to make sure performance doesn't quietly decline build after build, which only works if results get versioned, trended, and tied back to the code and config changes that produced them. CI passing is necessary. It just isn't sufficient. The pipeline has to keep working past the merge event, not stop there.
Capturing baselines that are worth comparing against
A baseline that means anything has to include latency percentiles (p50, p95, p99), error rates, throughput, and resource use, at minimum: CPU, memory, I/O. Anything less and the comparison gate is comparing against a guess.
Where does that baseline come from? Usually the last known-good build on the main branch, captured in a staging environment under production-representative load, or pulled straight from production via canary telemetry. Staleness is a real risk here, and an underrated one: a baseline captured under a different traffic pattern, or against an older dependency version, throws false positives at every build that follows, and engineers stop trusting the gate within a few weeks of that happening.
The fix is to version baselines the same way code gets versioned. Each build should reference the baseline from its direct ancestor, not some fixed snapshot from three months back. That's what "continuous" actually means in continuous performance validation, and it's also why relative thresholds beat absolute ones. An extra 50 milliseconds of latency sounds trivial on its own. If it's a 10% slowdown relative to the prior build, it's not trivial at all, and an absolute threshold would have missed it. Baselines belong in artifact storage next to the build outputs they came from, so they travel with the pipeline automatically instead of living as tribal knowledge in a dashboard somebody forgot to check.
Tiered quality gates: where in the pipeline regression checks belong
Regression checks don't all belong at the same depth. A commit gate runs fast functional checks, finishes in minutes, and blocks every merge to mainline, no exceptions. A build gate runs broader regression checks after a successful build, finishes in under an hour, and blocks promotion to test environments. A release gate runs the full regression suite before production and is the last line of defense before real traffic hits the new build.
The tension running through all three is thoroughness against speed of feedback. A gate that takes too long gets skipped the first time a deadline is tight, no matter how good its coverage is. The practical split most teams land on: a targeted regression subset on every pull request, kept under ten minutes, and a broader parallelized suite on main-branch merges. And a gate should block on more than test failure. It should block on deviation from baseline beyond a defined tolerance too. That's the difference between a gate that's a comparison and one that's just a pass or fail switch.
Flaky tests undercut all of this. 59% of developers run into flaky tests on a monthly basis, and in enterprise pipelines running thousands of tests per run, that flakiness compounds fast, to the point where engineers start ignoring failure signals out of habit. Gate design has to account for that, or the gate becomes noise. The cost of skipping gates altogether is well documented: fixing a bug in production runs about 30 times more expensive than fixing it during development, and organizations with weak regression discipline report roughly half their software budget going to post-release fixes.
Using ML-based build failure prediction to catch regressions before the gate fires
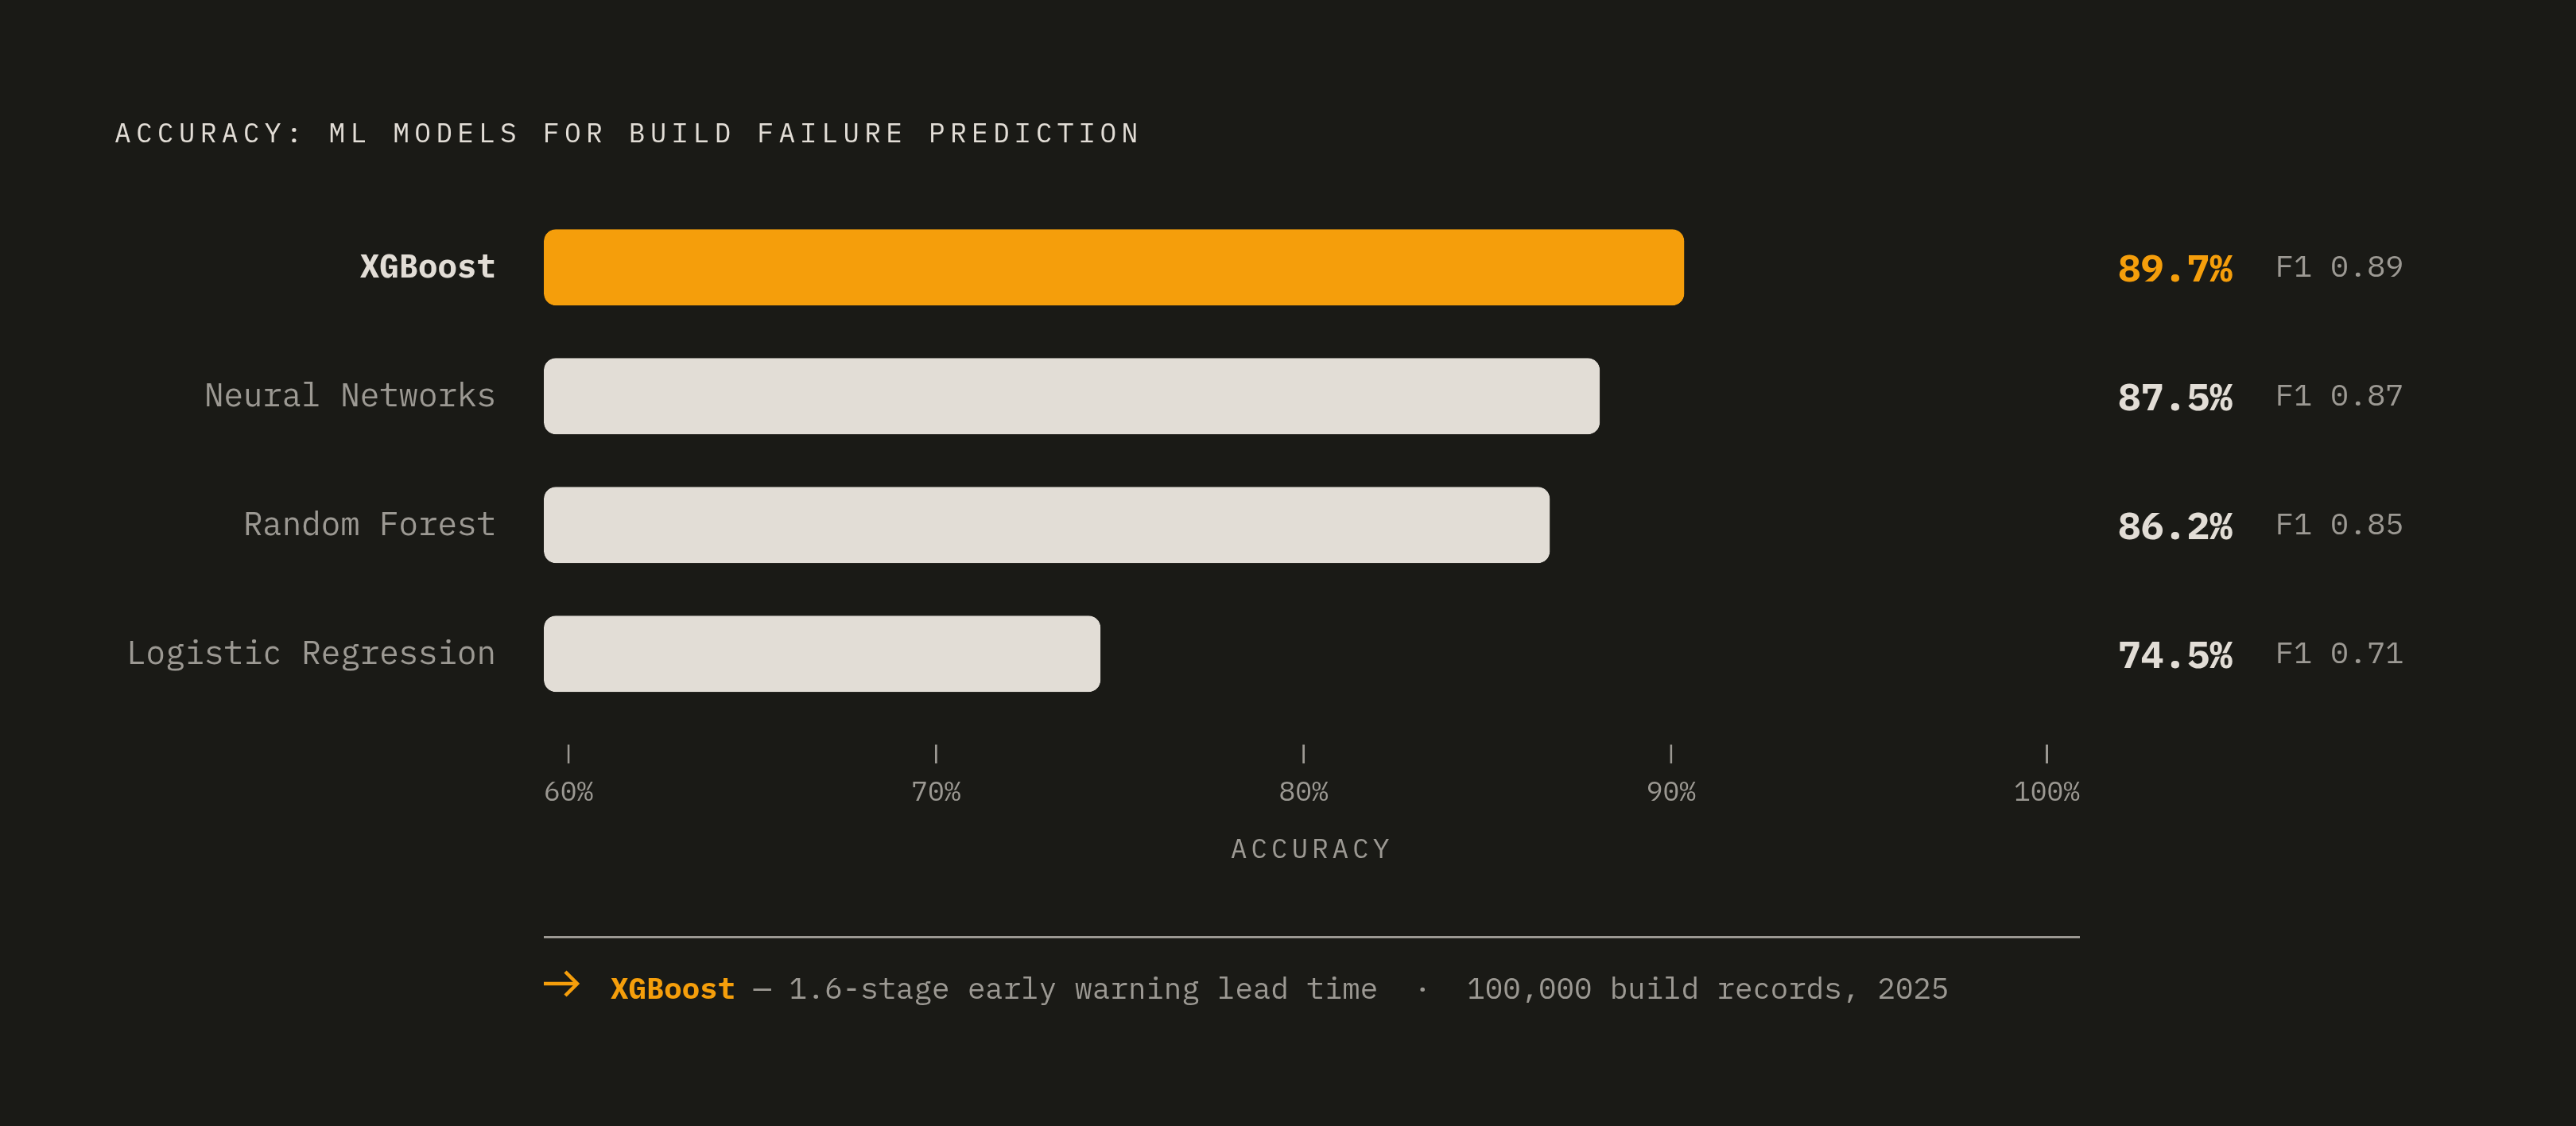
Some teams are training models on historical build telemetry to flag likely failures before the build even finishes, which buys lead time instead of a post-mortem. A 2025 empirical study published in Spectrum of Engineering Sciences, trained on 100,000 build records pulled from open-source Jenkins, GitHub Actions, and GitLab CI projects between 2020 and 2024, compared four approaches. XGBoost came out on top, achieving 89.7% accuracy, an F1-score of 0.89, ROC-AUC of 0.94, and an early warning lead time of 1.6 pipeline stages. Neural networks came close at 87.5% accuracy and an F1 of 0.87, but cost more to run. Random forest landed at 86.2% accuracy with an F1 of 0.85, and it's easier to interpret than the neural net, which matters when someone has to explain the flag to a team lead. Logistic regression trailed the pack at 74.5% accuracy and an F1 of 0.71, too simple for the patterns involved.
That 1.6-stage lead time means the model flags a likely failure before the stage that would have caught it, so the team gets an earlier intervention point instead of a wasted compute cycle. High-risk builds can get routed to deeper inspection automatically, without anyone waiting on the gate to fire. These models need a large volume of historical build data to train on reliably, making them a fit for mature pipelines and less useful for a team standing up CI/CD for the first time. Either way, the tiered gate structure from the previous section still has to be there. Prediction supplements the gate. It doesn't replace it.
Canary deployments as a live regression gate
A canary deployment routes a small slice of live traffic to the new build and compares its behavior against baseline in real time, before the rest of production traffic ever sees it. Two signals matter most here. Error rate: if the canary's error rate climbs above baseline, that triggers investigation before the build goes any further. Response time: if the canary's latency degrades against baseline, that triggers rollback before full deployment happens.
Google uses canary releases to validate every major rollout, so this isn't a theoretical pattern, it's one running at real scale. But a canary only counts as a gate if the comparison and the rollback decision are both automatic. A human looking at a dashboard after the fact isn't running a gate, that's an audit, and audits happen too late to stop a bad build from reaching everyone.
Canaries have a real limit too: they need enough live traffic to produce a statistically meaningful signal. A low-traffic service might not generate enough canary data to surface a regression at all, which is exactly the gap synthetic monitoring is built to fill.
Synthetic monitoring and smoke tests to cover what real traffic cannot
Smoke tests run immediately after every deployment: a handful of lightweight, automated checks confirming the core functionality still works. Cheap, fast, no excuse not to run them on every release. Post-deployment verification, more broadly, needs to cover release verification (core features, APIs, and services working under real usage conditions), performance monitoring (latency, throughput, resource use, and error rates under live traffic), and observability (log analysis, distributed tracing, and real-time metrics for troubleshooting incidents as they happen).
Synthetic monitoring covers a different gap. It scripts out key user flows, login, search, checkout, whatever matters most to the product, and runs them against production at regular intervals. That catches regressions on paths real traffic might not touch for minutes or hours after a deploy goes out. Smoke tests confirm the state right after deploy. Synthetic monitoring keeps checking as caches warm up, queues fill, and dependencies shift underneath the build. Both depend on the same underlying telemetry: logs, traces, metrics. If observability isn't built into the deploy process itself, neither one has anything real to compare against.
Feature flags as a regression isolation and rollback mechanism
A feature flag lets a team turn a specific feature on or off at runtime, without redeploying anything, which decouples the act of shipping code from the act of activating a feature. When a canary or a synthetic check flags degraded behavior tied to one feature, the flag gets switched off immediately while a fix gets prepared, no full rollback of the build required.
Tracking latency and resource use against flag state is what narrows this down fast: if the regression only shows up when a flag is on, it's feature-specific, not build-wide, and that distinction saves a lot of wasted debugging time. The tradeoff is that flags add their own complexity. Stale flags nobody cleans up turn into configuration debt, and after enough of them pile up, nobody's entirely sure which code path is actually live in production. Flags are a post-deploy control mechanism. They shorten the time it takes to recover from a regression. They don't replace the detection work that pre-deploy gates and canaries are doing.
Building observability into the pipeline rather than bolting it on afterward
The shift-left approach means adding automated observability checks directly into CI/CD, requiring consistent instrumentation as part of code review, and shipping every new feature with metrics, logs, and distributed traces defined up front, not added after something breaks. "Consistently instrumented" has a specific meaning here: every service emits the same categories of signal, latency, error rate, throughput, resource use, in a format that can actually be queried, instead of ad hoc logging that looks different from team to team.
Skip that step and a canary comparison gate produces false negatives, passing builds not because they're safe but because the telemetry needed to catch the problem was never captured in the first place. Distributed tracing matters most when a latency regression does surface: traces show exactly which service or call in the chain slowed down. Without them, engineers end up reconstructing the incident in a Slack thread instead of just reading the evidence the pipeline already had.
Tool sprawl works against all of this. Every extra system an engineer has to check during an incident is time the SLO clock keeps running, so the instrumentation strategy should pull signals together rather than scatter them across five separate dashboards. SAP SE's patent (US 12,079,111 B2, granted September 3, 2024) formalizes this at the architecture level: the CI/CD execution engine writes structured deployment logs identifying not just that an error happened, but which portion of the software generated it and on which computing device. Structured, queryable error context is a pipeline output here, not an afterthought someone has to dig for.
Automated error pattern matching and self-healing pipelines
The same SAP patent describes a pattern-matching loop: when the CI/CD engine detects a deployment error, it processes that error to identify a pattern, checks that pattern against historical errors by how often they've occurred within a set interval, and returns a solution based on the match. The fix comes from resolution history the pipeline already has, not from an engineer reading through logs from scratch.
That means a recurring deployment error a team has already resolved once gets resolved automatically the next time it shows up. The pipeline is learning from its own past, in a narrow but useful sense. Self-healing pipelines take this further still, watching execution times, resource use, and error rates continuously, and triggering automated remediation the moment an anomaly matches a known class of problem, instead of paging someone for something the system has already fixed before.
There's a clear boundary for where a human needs to step in. Low-confidence or genuinely novel error patterns escalate to a person. High-confidence matches with known solutions get resolved without one. Platforms built on this principle report reclaiming over 200 engineering hours a month, hours that would otherwise go to chasing down problems the system has already solved once. The right output for a detected regression is a reviewed fix PR sitting in someone's queue, not a war-room Slack thread at 2 a.m. OnePatch operationalizes exactly this: it sits between pull requests and production, checks every PR against real telemetry once it's live, catches regressions before anyone gets paged, and opens fix PRs on its own, closing the loop the rest of this piece has been building toward.
Alert noise as a symptom of missing pipeline-native verification
Alert noise doesn't come out of nowhere. It shows up when there's no earlier gate filtering the signal, so broad, threshold-based alerts fire on every deviation and the monitoring system ends up doing work the pipeline should have done in the first place. Three kinds of noise follow from that: false positives, where normal behavior trips a misconfigured threshold; redundant alerts, where five notifications point back to the same underlying regression; and over-sensitive triggers, where a minor blip gets treated as an emergency when it needs no action at all.
The cost of that noise compounds. Constant context-switching drags down productivity. Real signals get buried under the noise, which slows down response time exactly when speed matters most. Decisions made under that kind of fatigue tend to be worse decisions, and error rates climb as a result. Eventually it wears engineers down enough that they leave. Alert noise is a symptom of deeper design issues that better thresholds alone cannot fix. It's a symptom of a pipeline that never had verification built into it in the first place, and no amount of alert tuning fixes a gate that was never there.