From Alert to Reviewed Pull Request Without Paging On-Call
Automated tools can now diagnose production problems and generate fixes without waking engineers.
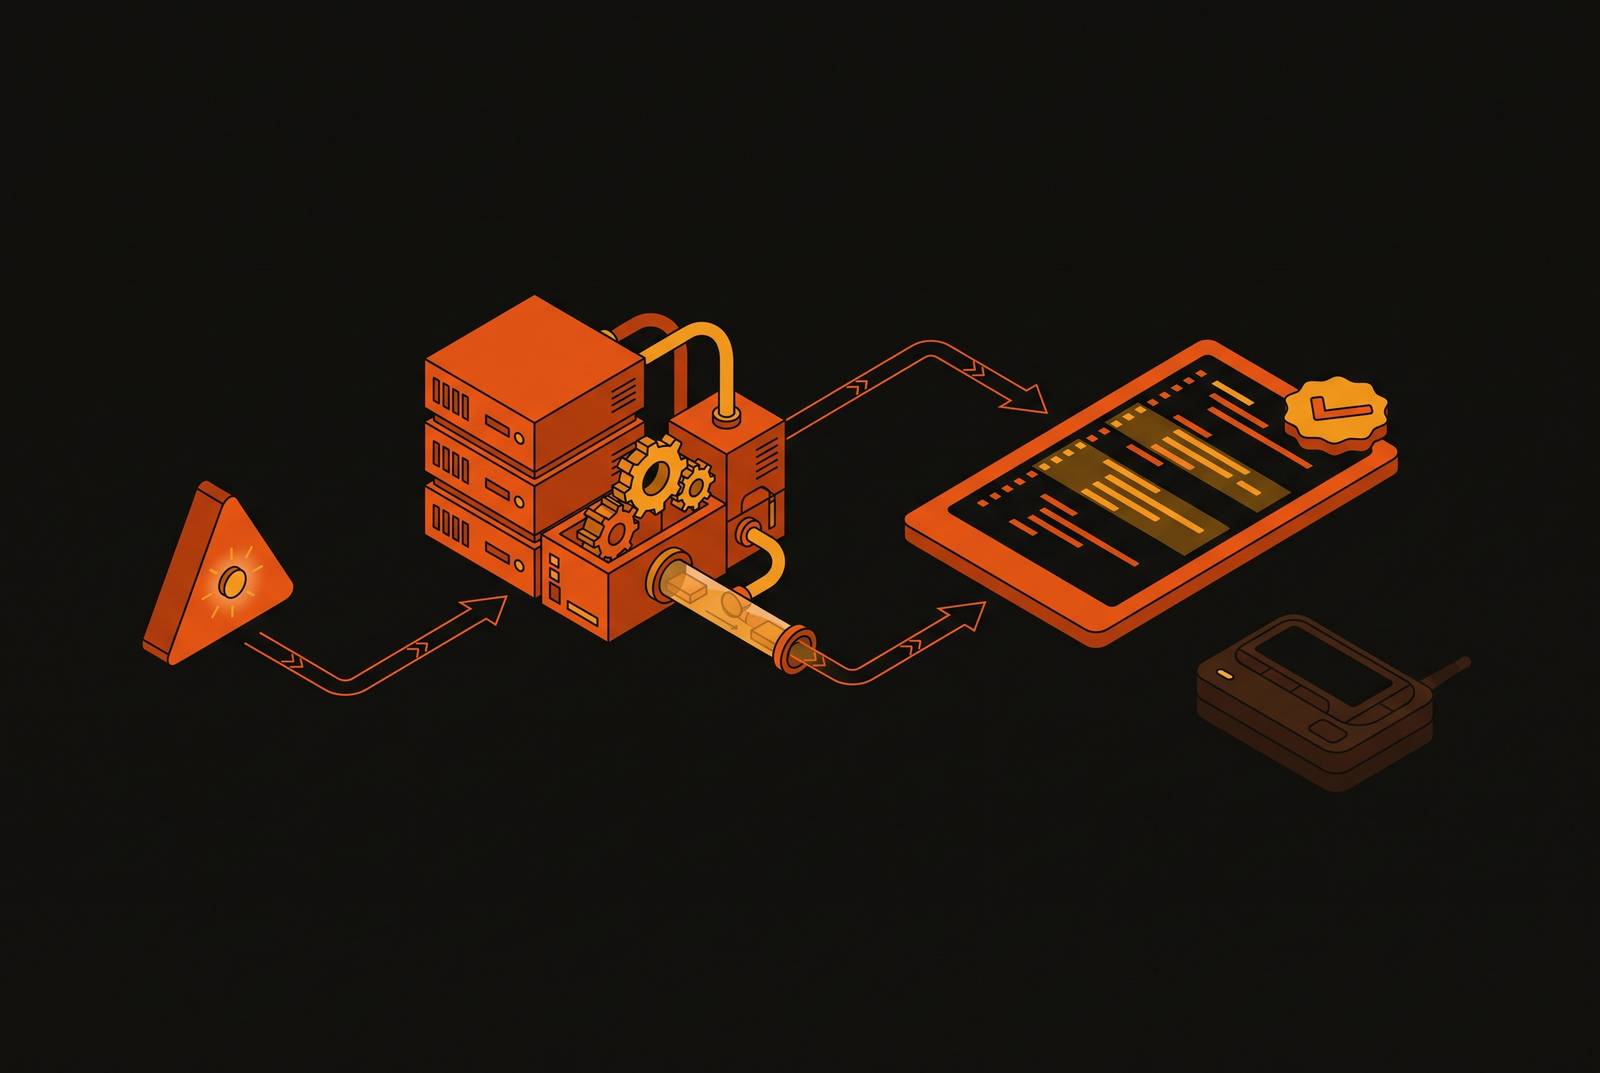
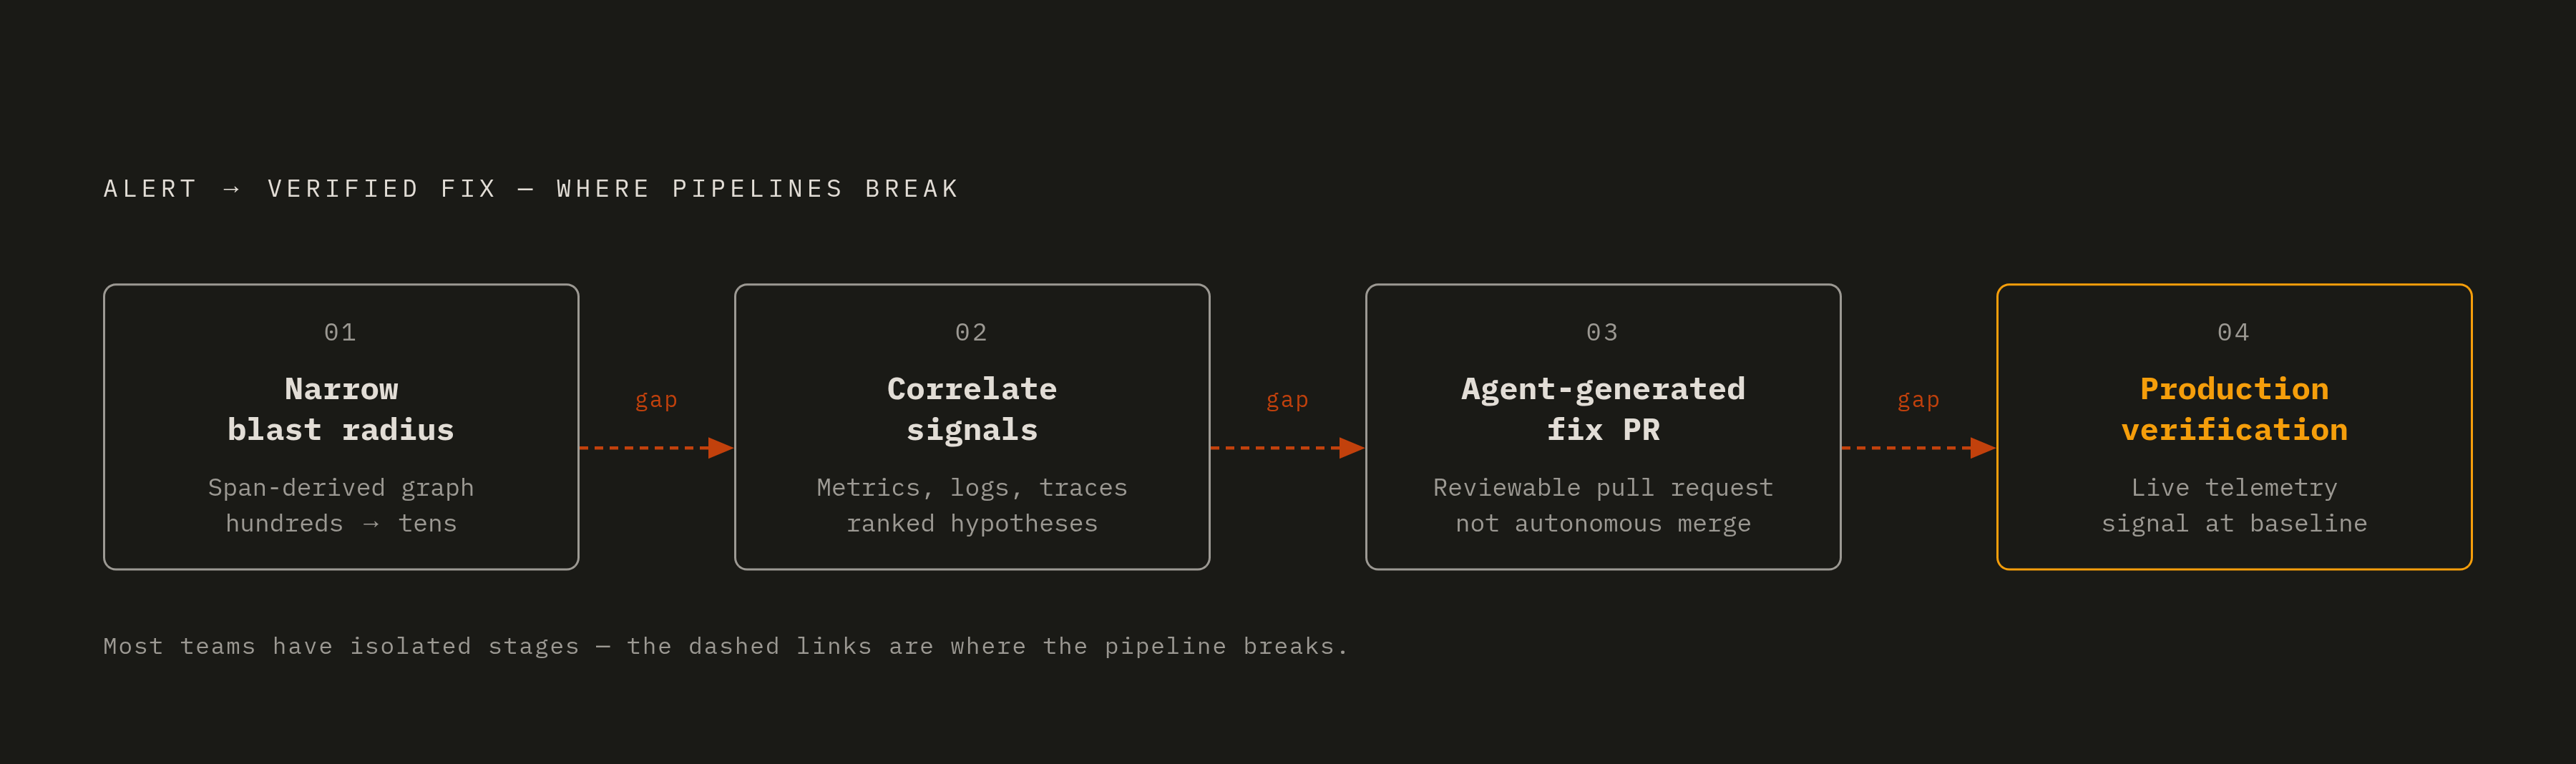
A fully automated path from production alert to reviewed fix pull request is technically possible today. It requires four distinct stages, telemetry correlation, hypothesis ranking, agent-generated code repair, and production verification, wired together as one continuous pipeline rather than left as separate tools a human has to carry context between. Most teams have some of these stages. Few have all four connected, and the gaps between them are where the pipeline still breaks.
Why the four-stage pipeline exists
Atlassian engineers have described the incident response workflow that most on-call teams still run today, and it is worth laying out in full because every stage of the automated pipeline exists to replace one of its steps. An on-call engineer gets paged. They open a metrics dashboard and spot an anomaly in error rate or latency. They pivot to a logging tool and search for exceptions in that window. They open a tracing UI and inspect individual request paths. They hold all three views in their head at once, looking for a pattern that connects them, form a mental hypothesis about where the fault sits, then work backward through the service dependency graph to check whether that hypothesis holds up.
None of those steps is hard on its own. That's the real cost of the serial, human-driven process, and it scales directly with experience. An engineer with years of exposure to the system's quirks can run this loop in minutes. Someone newer to the service takes a lot longer, and during a user-facing incident, every extra minute compounds into more affected users and a longer time to resolution.
The human fills the gap left by detection tools that don't talk to one another, acting as the integration layer between a metrics tool, a logging tool, and a tracing tool. A four-stage pipeline exists to take over that integration role: narrow the search space, correlate the signals, generate a fix, and land it as a reviewed artifact, without requiring a person to hold all three dashboards in their head at 3 a.m.
Stage one: narrowing the blast radius before any human looks at telemetry
Before any correlation can happen, the search space has to shrink. An enterprise running hundreds of interconnected microservices can't have an automated system scanning all of them for every incident, the noise would overwhelm any correlation logic before it produced a useful answer. The first stage of the pipeline exists to solve that problem: when an incident is detected, the system queries a service dependency graph to find the specific set of services that sit in the call path of the degraded user experience. That typically narrows the field from hundreds of services down to tens.
What makes this step trustworthy is where the dependency graph comes from. Atlassian builds it from OpenTelemetry-derived service maps: the span-level parent-child relationships actually observed in live production traffic, not from an architecture diagram someone drew eighteen months ago and never updated. A service map built from real traffic reflects how the system actually behaves under load, including the undocumented calls and quiet dependencies that architecture docs tend to miss.
That real-time accuracy comes with a condition attached: the graph only knows about the services that are instrumented to emit spans. One Patch, and systems built like it, depend on this same scoping step: a focused, span-derived service map is what turns "search everything" into "search the twenty services that matter," and a dark service breaks that promise regardless of which tool is doing the correlation downstream.
Stage two: correlating metrics, logs, and traces into ranked hypotheses without human cross-referencing
Once the search space is narrowed, the pipeline has to do the part a human on-call engineer does by eye: line up anomalies from different signal types, on a shared timeline, against the service topology, and figure out which ones are telling the same story. Atlassian's framing treats root cause analysis as a correlation problem across three dimensions at once, signal type, time, and topology, and the claim is that if anomalies are detected independently in each signal and then aligned against those three dimensions, a system can produce ranked hypotheses about where the fault originated without a human ever having to build that mental model by hand.
Each signal type gets its own detection method, running in parallel. Metrics, the rate, error rate, and duration numbers that make up the RED signals, get checked with statistical methods: median absolute deviation to catch sudden spikes, percentile bands to catch slower, sustained drift. All three detectors output events in the same normalized schema, timestamp, service, signal type, severity score, supporting details, which is what lets the next step reason across signal types without needing to know which detector produced which event.
The correlation step uses a sliding time window, typically around five minutes in either direction, to group anomalies that happened close together into bundles, and each bundle gets a cohesion score that favors tightly clustered anomalies over ones spread thin across the window. Sequence fingerprinting, a technique used elsewhere in cloud-native incident response work, collapses those repeats into a single bundle, so a responder sees "this failure pattern repeated many times in five minutes" as one entry.
The system doesn't hand back a single answer. Microsoft's own work in this space backs up the broader point. Its eARCO system showed that prompt optimization against a large corpus of historical incidents improved RCA accuracy by 21% over retrieval-augmented LLMs, which says something beyond the specific number: a company's own incident history is training material for future diagnosis, not just an archive for postmortems nobody rereads. This stage is what replaces the visual pattern-matching an engineer used to do across three separate dashboard tabs, normalizing metrics, traces, and logs into one timeline and one topology so that a ranked hypothesis comes out the other end without a person stitching the story together by hand.
Stage three: agent-generated fix PRs now generally available
Diagnosis used to be where the automation stopped. That's no longer true: agent-generated fix pull requests have moved from research demo to production tooling, and two distinct approaches are now live.
Rootly runs a different model, built around orchestration that guides an agent through a predefined workflow across a codebase. That turns what used to be an improvised, manual response into something guided and logged at every step. It suits incidents with a known shape, a pattern the team has already built a playbook for, rather than a novel bug that needs a human-grade reading of unfamiliar code.
Automated fix generation creates its own new category of risk worth taking seriously. The sources that describe these systems answer that objection the same way: none of this is built to merge autonomously. It's built to produce a reviewed pull request, and the actual governance question is whether that review carries weight or just rubber-stamps whatever the agent proposed. The agent including its own explanation of what it changed and why is what makes a substantive review possible in the time pressure of an active incident, rather than leaving a tired engineer to either block the fix or wave it through blind.
Stage four: the pull request as the incident's terminal artifact
The last design choice in this pipeline is about where the incident actually ends. Treating a reviewed fix PR as the resolution artifact, rather than a status-page update or a war-room thread that eventually goes quiet, changes both how fast the incident resolves and what record of it survives afterward.
A pull request is executable in a way a Slack thread never is. A pull request is also attributable in a way a verbal handoff isn't. Rootly's platform makes this concrete by automatically logging the incident timeline, the decisions made, and the communications sent, alongside the remediation action itself, keeping the PR inside a linked record.
Set that against the war-room model most teams still run. The postmortem gets written hours later from memory, and whatever understanding the responder built while fixing the problem leaves the company the day that person does, because it was never written down anywhere durable. A pull request doesn't have that failure mode built in.
But a merged PR by itself doesn't prove the incident is over. A verification pass against live telemetry, checking that the specific signal which triggered the incident has actually returned to baseline, is what turns "merged" into "resolved." That gate is the natural point where a tool like One Patch fits into the pipeline. It isn't the thing writing the fix; it's the check that confirms the fix did what the PR said it would do once it's running against real traffic.
Where the pipeline breaks today
Every stage described above is achievable with tooling that exists right now. The coverage and the connective tissue between tools are what's missing in most production environments, and both gaps are structural, requiring more than a config change to fix.
Instrumentation coverage is the first and most basic gap, and it sits directly underneath stage one. The GenAI semantic conventions inside OpenTelemetry remain in Development status rather than Stable as of version 1.41, and were later moved into their own repository in version 1.42.0, where they're still in Development with no tagged release. That instability matters for a specific reason: attribute names in a Development-status convention can change without a major version bump, so any pipeline consuming those attributes to reason about AI-generated regressions is building on a schema that can shift underneath it.
The second gap sits between tools, not inside any one of them. Fragmentation of this kind is common enough that 59% of teams name the lack of a single, unified solution as the biggest unmet need in observability tooling. The number of observability tools running inside the average enterprise has climbed back up after a period where teams were actively consolidating, and the reversal tracks closely with AI adoption pulling in a new wave of narrow, AI-specific point tools. Each new tool adds a monitoring surface faster than teams can wire it into the ones already in place.
Alert hygiene compounds both problems. If a large share of an organization's alerts haven't required a human to act on them in the past 90 days, those alerts are adding noise the correlation engine has to filter rather than signal it can use, and running automated correlation over a noisy alert stack produces hypotheses that look confident and are wrong. AI-generated code adds one more wrinkle on top of all of this. The constraint on shipping speed was never how much code a team could produce. If production verification doesn't keep pace with how much code AI tools let a team generate, the automation has removed the wrong bottleneck.
What teams need to close each gap
Closing the distance between the pipeline as designed and the pipeline as most teams can actually run it comes down to four concrete prerequisites, and the order they get tackled in matters, because a later stage can't make up for a gap left open in an earlier one.
The first prerequisite is instrumenting the services that are currently dark to the dependency graph, since that graph is only as complete as the OpenTelemetry coverage feeding it. eBPF-based auto-instrumentation at the kernel level now offers a realistic path to zero-code tracing for services whose owners haven't added SDK-level instrumentation yet, and the services worth prioritizing first are the ones sitting in the most critical call paths, not the easiest ones to instrument. A straightforward rule applies here: delete any alert that hasn't required human action in 90 days rather than spending time tuning it, and apply the same discipline to flaky tests on critical repositories, since tests that already fail unpredictably erode trust in change validation, and AI-generated code only widens that gap if it isn't addressed first.
The third prerequisite is mapping and closing the handoffs between tools explicitly, since postmortem evidence consistently points to failures at the boundaries between systems. The fourth is making the review stage genuinely substantive rather than a formality performed under time pressure. When an agent includes its reasoning and its validation steps in a pull request, it gives a human reviewer something concrete to check against, so a short, consistent checklist, what changed, what was re-run to confirm the change works, which adjacent services could be affected, turns approval into an informed decision.
One Patch occupies the last link in this chain. Once a fix PR merges, the open question is whether the regression that triggered the incident actually went away, and automated verification against real production telemetry answers that question directly. Without that check, the pipeline ends at a reviewed, merged pull request that may or may not have fixed the condition it was written to fix, and the team finds out which only when the next alert fires. Where this is headed, on the evidence from Atlassian's own work, is toward iterative agent orchestration, systems that don't just hand off a single ranked hypothesis but refine it across multiple passes as new telemetry comes in. That capability isn't fully built out yet, but the direction is clear enough that teams closing today's four prerequisites are also building the foundation the next version of this pipeline will need.