What On-Call Engineers Actually See When a Post-Deploy Health Check Fails a Pull Request
Automated post-deploy health checks catch real production failures before on-call pages.
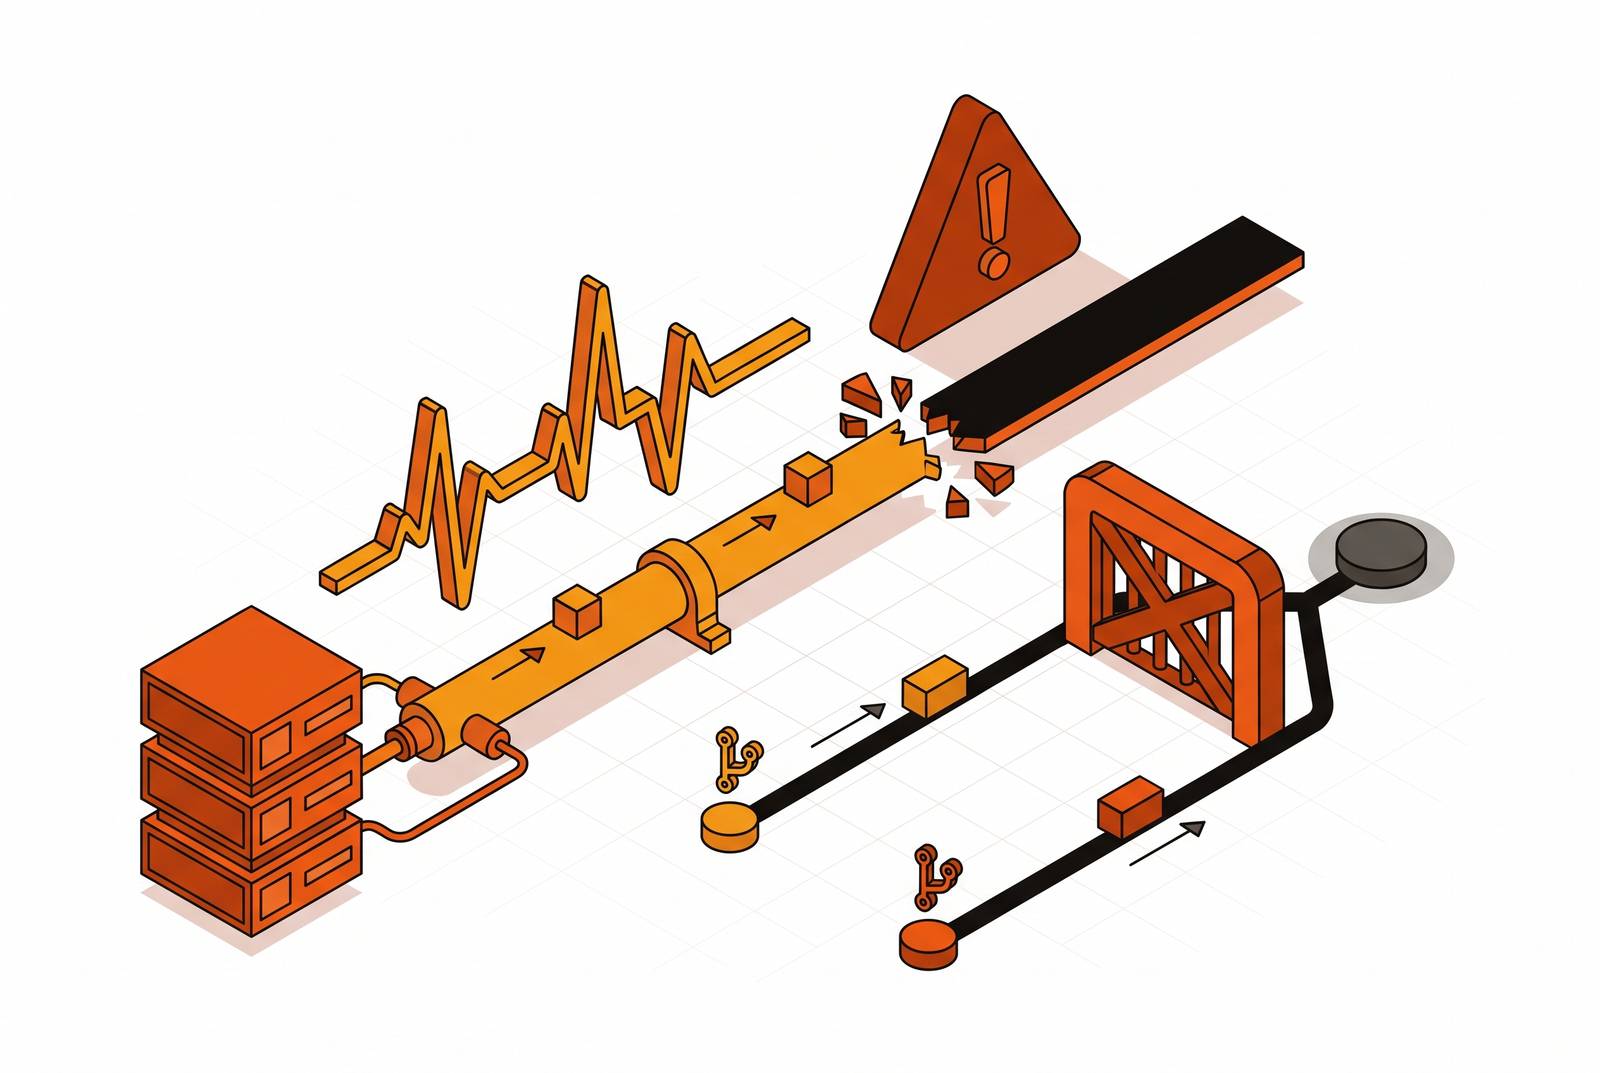
A deployment can report success while the service behind it is not serving a single request, and that gap is where every on-call incident described in this piece begins. The fix for it is automated post-deploy verification tied to the pull request that shipped the change: something that checks live production telemetry, not just a CLI exit code, before anyone calls the deploy done. KestrelSovereignAI issue #2473, filed in July 2026, shows the mechanism directly: DeployManagerCore marked the session ACTIVE, called its internal _verify_health() routine, got back a failed probe, mapped that failure to health_status="unknown", and still returned success=True. The command line exited cleanly and printed a success message for a service that was not actually up. A reproduction using a fake provider with _verify_health=False returned exactly this: {success: True, status: active, health_status: unknown}.
The defect sits in how the system translates a health check result into a status field. A failed probe should block a success flag. Instead, it gets mapped to an ambiguous middle state, "unknown," that still allows the overall result to report true. This conflates two separate facts that the deployment layer owes the rest of the team: that a revision was created and accepted by the control plane, and that the thing being deployed is ready to take traffic. Those are not the same claim, and nothing downstream can tell which one it actually received once "unknown" has been folded into "success."
A second, distinct version of the same surface symptom comes from the probe never reaching the application. OneUptime's Calico runbook, published in March 2026, describes the defining pattern: multiple pods in a namespace go NotReady at the same moment, shortly after a NetworkPolicy gets applied or changed. The application itself may have started cleanly, bound to the right port, and logged nothing unusual. The kubelet's probe is blocked by the policy before it ever reaches the application. Recovery, once the node CIDR is allowed, takes under ten minutes, but only after someone recognizes that the failure is in the network path and not in the code. OneUptime's Elastic Beanstalk guide, from February 2026, lists health check failure as the most common deployment failure class overall, with wrong port binding, a health check path returning a non-200 response, a crash on startup, and slow startup (where the probe fires before the app is ready) as the dominant causes beneath it.
This success/unknown conflation is precisely what automated production verification exists to catch. Tools like One Patch monitor production telemetry right after a deploy ships and surface real readiness failures before a human on-call engineer ever has to page into a Slack thread to figure out what happened, closing the space between what the deployment layer claimed and what production is actually doing.
What the On-Call Engineer Sees First
You don't open your laptop to an obvious failure. You open it to a deployment that, by every automated signal your team built, went fine. The CI pipeline passed. The deploy job exited zero. No rollback fired. The pull request merged cleanly, and every gate your team put in place to catch a bad release signed off on this one.
What you're looking at is a deploy that succeeded and then something, somewhere, started failing in a way none of your automation caught at the moment it happened. That's a harder problem to hold in your head than a clean failure, because a clean failure tells you where to look. This tells you nothing except that the story you were told, "the deploy worked," might not be true, and you have no way yet of knowing how far the gap extends.
Synapse-bridgez issue #1290, filed in September 2026, describes exactly this situation: readiness and liveness probes existed in the code. Nobody had wired anything to watch them continuously right after a deploy and act on what they saw. A regression made it to production and sat there until a human happened to notice degraded metrics, or until an alert eventually fired, well after real users had already been affected. The probes were doing their job. Nothing was listening to them in real time.
You have a deploy timestamp. That's your anchor, the one fixed point in the timeline. But the health check failure may become visible at a different time entirely, and that gap between when the deploy landed and when the symptom was noticed is where the causal chain gets murky. If the actual fault lives in a dependency, a sidecar, a managed service, or the network layer rather than in your application code, your application logs will show you nothing wrong. You're left holding the one question that actually matters and that nothing in front of you answers yet: is this the deploy, or did something else change?
The instrumentation gap that turns a simple question into a long search
That question should take a minute to answer. It routinely takes an hour or more, and the reason isn't that the underlying problem is complicated. The telemetry that should connect a deploy event to a production symptom is frequently missing, scattered across tools that don't talk to each other, or never generated.
Take request correlation. Tracing a failed health check back to the code path responsible for it requires a request ID that propagates across every service call in the chain. Without it, you see a 503 and have no way to walk it back to its origin. OPS-1 issue #100, open as of October 2026, lists a task requiring the system to emit structured server-side error context, including route information and request correlation data, specifically because that data wasn't being captured. An open issue asking for something this basic, this late, says something about how often production systems ship without it.
Logs, metrics, and traces together still leave a code-level gap in understanding why a process is behaving the way it is. That gap is why continuous profiling exists as a fourth signal alongside them. When a probe fails at the infrastructure layer, an application never even sees the request, so there's no error entry to find. Your application log shows silence instead of an error, and silence reads very differently from a stack trace: it tells you nothing happened where you're looking, not what went wrong.
So you start opening tools. The deployment log. The probe status dashboard. The application log. The network layer, if you have visibility into it. Maybe a WAF or CDN console, if you suspect the rejection happened before your infrastructure ever saw the request. Each interface shows you a fragment, and none of them hands you the full picture. You're the one carrying context from one tab to the next, holding the timeline together in your head while the clock keeps running. Every additional tool you open during a live incident is time your SLO is burning, and the search itself, not the underlying fault, is often the largest share of time-to-resolution.
The disorientation here isn't incidental. It happens because deployment completion and production readiness get treated as two separate events with nothing automated connecting them. When a platform verifies every pull request against live production telemetry after it ships, the first signal an engineer gets is a definitive post-deploy health assessment, not a pile of secondhand evidence they have to assemble by hand.
Alert noise and early engineer judgment
By the time you see the health check failure, you've already made a judgment about it, and you made that judgment before reading a single log line. Most of the alerts that land in front of you on an ordinary day don't require action. That experience trains a reflex, and the reflex doesn't turn off just because this particular alert happens to be the one that matters.
Alert fatigue, as one industry guide on the subject describes it, comes mostly from poorly tuned monitors, redundant toolchains, and alerts that arrive with no context and no clear owner. None of those are failures of the engineer receiving them. They're failures of the systems generating them, and the predictable outcome is that engineers learn to discount alerts as a matter of self-defense, because treating every one as urgent is not a sustainable way to do the job.
That conditioning is visible most clearly at shift handoff. An outgoing engineer, worn down by a day of noise, writes "all quiet" in the handoff notes even when a service has been flapping for hours, a late deploy never got validated, or some noisy alert has been firing on and off all week without ever getting resolved. The incoming engineer inherits that note as a baseline, and the baseline is wrong. So when a real health check failure occurs, it doesn't arrive as a clean signal. It arrives as one more entry in a queue of things that are probably noise, and the first decision an engineer has to make is whether it's real before any actual diagnosis starts.
Telling engineers to simply pay closer attention doesn't fix this, because the behavior isn't a discipline problem. Discounting alerts in an environment where most of them are false is a rational response to the environment, not a lapse in rigor, and no amount of individual vigilance changes the math of a system that cries wolf more often than it doesn't.
Walking the actual diagnostic sequence: what a trained engineer does, step by step
Once an engineer rules out a transient blip and confirms the failure is reproducible, the work that follows has a shape to it. It isn't guesswork, even though it can feel like it from the outside. Each step is designed to eliminate one category of explanation before moving to the next, narrowing a wide field of possible causes down to one.
The first move is establishing scope before touching anything. Is this one pod, one deployment, one region, or something broader? A quick command like kubectl get pods -A -o wide | grep -E "Error|CrashLoop|Pending|Evicted" gives a fast cross-namespace picture of the blast radius. If several pods in a single namespace all went NotReady at the same moment, that pattern points almost certainly to something infrastructure-level: a NetworkPolicy change, a node problem, a dependency failing, not a bug in the application code. OneUptime's Calico runbook lays out the fix for exactly this case: identify the namespace and the policy blocking traffic, apply the node CIDR fix, confirm the probe recovers. Ten minutes, once the pattern is recognized for what it is.
The second move is confirming whether the probe reached the application. If there are no HTTP log lines for the probe requests, that absence is itself the answer: the problem isn't in the app, because the app never got the chance to fail. If probe requests do show up in the log and come back with a non-200 response, the failure is on the application side, and the next places to check are the health endpoint path, the port binding, and how long the app takes to become ready after startup.
The third move is questioning the assumption that CI passing meant production was ready, because a deploy log's exit code is not evidence that a service is handling traffic. OPS-1 issue #100 describes the actual fix for this gap: a post-deploy smoke check built into CI that waits for the deployed service to respond and fails the deployment job outright if it isn't ready. Without that gate, a deploy "completes" well before anyone confirms the service is actually live, which is the exact condition that put the engineer in this situation to begin with.
The fourth move is checking for external rejections dressed up as application failures. A managed security layer or a CDN can return a non-200 response to a health probe while the application behind it is perfectly healthy. From the deployment system's point of view, that looks identical to an application failure, but the fix lives in the probe configuration or the security layer's rules, not in the app's code.
The fifth move is reading the logs to tell apart a crash on startup and a slow startup, because they call for different responses at different speeds. OneUptime's Elastic Beanstalk guide notes that application crashes on startup appear in web.stdout.log, while a slow startup calls for increasing the health check grace period.
Where automated post-deploy watching exists
Most teams already have the probes. What they're missing is something watching those probes continuously after a deploy ships and acting the moment something looks wrong. The gap is the absence of an automated loop that observes the result and responds without waiting for a person to notice.
Synapse-bridgez issue #1290 requested a post-deploy watch step because nothing was monitoring the probes after release. The fix requested was a post-deploy watch step: poll health and key error-rate metrics for a configurable window after each release, roll back automatically to the last known-good version if something looks wrong, and alert the on-call channel the moment that happens. The issue existed because none of that was built, even though the underlying readiness and liveness probes had been in the codebase the whole time. The data needed to catch the regression was there. Nothing was reading it in real time.
That's the window where automated verification earns its keep: the period right after a merge, when a regression is most likely to appear and most actionable if caught immediately. Post-deploy regression detection built to watch that window can surface a production failure before an on-call engineer has to manually stitch together a deploy log, a probe status, an application log, and a network trace to figure out what happened and when. For a team evaluating options here, the actual criteria worth comparing are concrete: does the tool tie its verification to the specific pull request that shipped, does it check real production telemetry rather than a synthetic smoke test, and does it roll back automatically or just alert and wait. One Patch is one option built around exactly that pattern, verifying each pull request against live production signal after it ships rather than trusting a green CI run as the final word. The diagnostic sequence walked through above works. It simply shouldn't be the first line of defense, because every minute an engineer spends running it by hand is a minute a machine could have spent running it first.