Stop Getting Paged for Deployment Regressions by Automating Post-Deploy Verification
Automated checks after deployment catch regressions before they page on-call engineers.

A passing CI/CD pipeline just tells you your code moved from one environment to another without incident. - imperative/conditional + "and" consequence, needs split.
Pipeline success versus production health
The sequence is familiar to anyone who has carried a pager: an engineer merges a pull request, watches the pipeline turn green across every stage, closes the laptop, and gets paged an hour later because a service is leaking memory or a database query has gone slow under load. Nothing in the pipeline lied. Every test passed, every lint check cleared, every health endpoint returned healthy. The pipeline did its job, which is to land code reliably. It was never built to answer a separate question: is this code behaving correctly now that it's handling real requests, real data volumes, and real downstream dependencies?
That second question is what post-deploy verification exists to answer, and most teams don't have a dedicated process for asking it. None of this means the pipeline failed. It means the pipeline was never designed to catch it, because deployment and verification are two different acts with two different jobs. Deployment automation moves code from one place to another. Octopus's deployment automation guidance states the underlying principle: teams should design deployments for observability, not just success. Deploy-induced regression also happens to be one of the more tractable failure modes in production: the pattern of detection is consistent, and the remediation playbook is well understood, which makes automating the check worthwhile.
Alert Noise and the Perception Gap
When teams don't have a verification step built into the deployment process, the instinct is to compensate with more alerting. The intention is reasonable. The effect, over time, is that the alerting system trains engineers to stop trusting it.
When most of the alerts that fire aren't actionable, on-call engineers adapt by filtering on instinct rather than evidence, and in the worst cases, customers notice the outage before the monitoring stack does.
None of this is a discipline problem on the engineer's part. Automated post-deploy verification platforms scope monitoring to deployment context instead, so they connect every anomaly to the code change that likely caused it. The trap is structural: turning the alert volume up buries the real signal further, and turning it down risks missing the next regression. So a verification layer built around deployments specifically is still missing. What's needed is a narrower, more targeted question than "is something wrong anywhere in the system," and that's a different category of tool from general-purpose monitoring.
What post-deploy verification does that general observability does not
General observability tools answer broad questions: how is the system behaving, across which services, over what time window. Post-deploy verification asks something narrower and more urgent: did this specific deployment cause this specific degradation, and should the rollout continue or stop.
The distinction matters because the two tools genuinely answer different questions, even when they draw on the same underlying telemetry. A dashboard can show a latency curve bending upward. Observability platforms are strongest at correlation: tying together logs, metrics, traces, and infrastructure signals across time and across services. Continuous verification platforms are strongest at a narrower, sharper task: making an automated pass/fail call scoped to a single rollout. Most teams already have the first category installed somewhere in their stack. The second category is where the actual gap sits for most organizations.
Closing that gap starts with discipline that sounds almost too simple to matter: tagging every deployment with its Git commit SHA and timestamp, and sending that information to dashboards as annotations. That step is necessary but not sufficient on its own. It only does real work when the pipeline also checks that observability itself is functioning after the deploy lands. If metrics, logs, and traces stop flowing after a release goes out, the deployment should fail outright, because a release nobody can observe is a release nobody can verify.
The two mechanisms that make automated post-deploy verification work
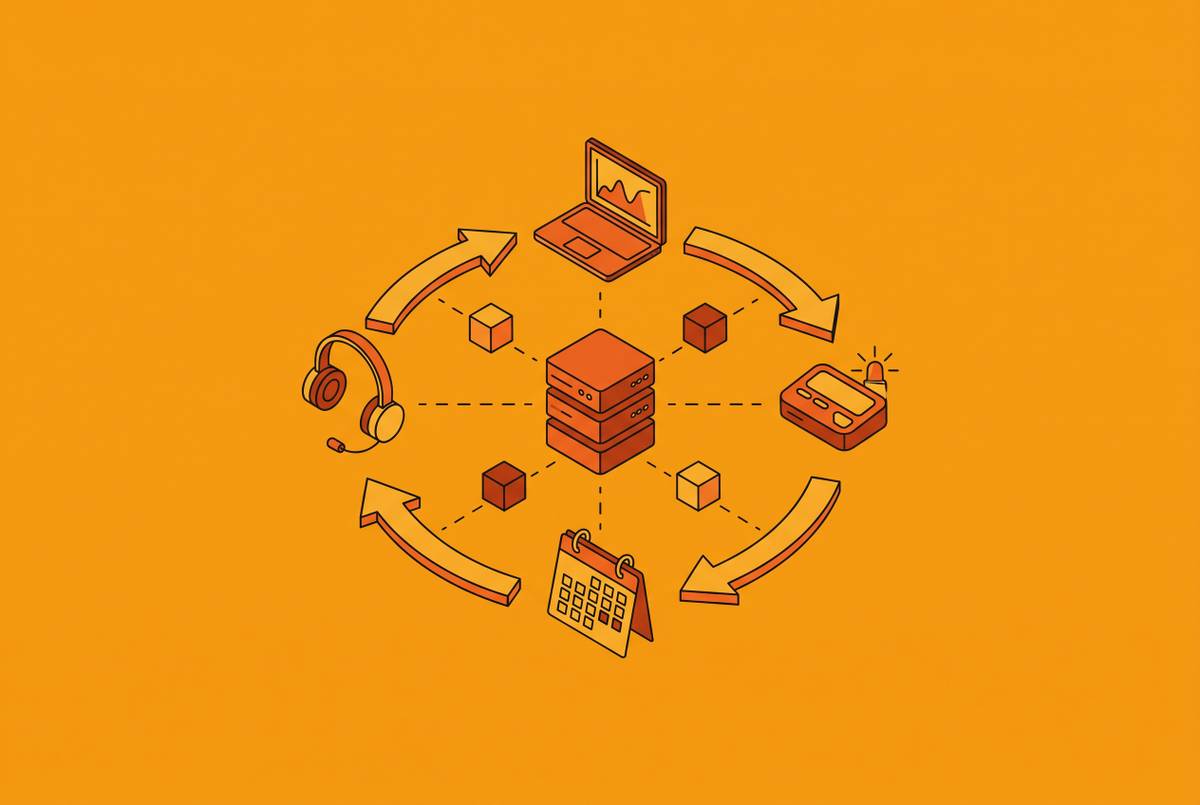
Automated post-deploy verification runs on two mechanisms that work together: continuous verification against a telemetry baseline, and canary analysis with automated rollback gates.
Continuous verification works by comparison. After a deployment lands, the platform pulls live telemetry, lines it up against the baseline recorded before the deploy, and makes an automated pass or fail call on whether the new behavior falls within acceptable range. That automated decision is what separates verification from passive monitoring: a dashboard waits for a human to notice a problem, while a verification system checks for one on a schedule tied to the deployment itself.
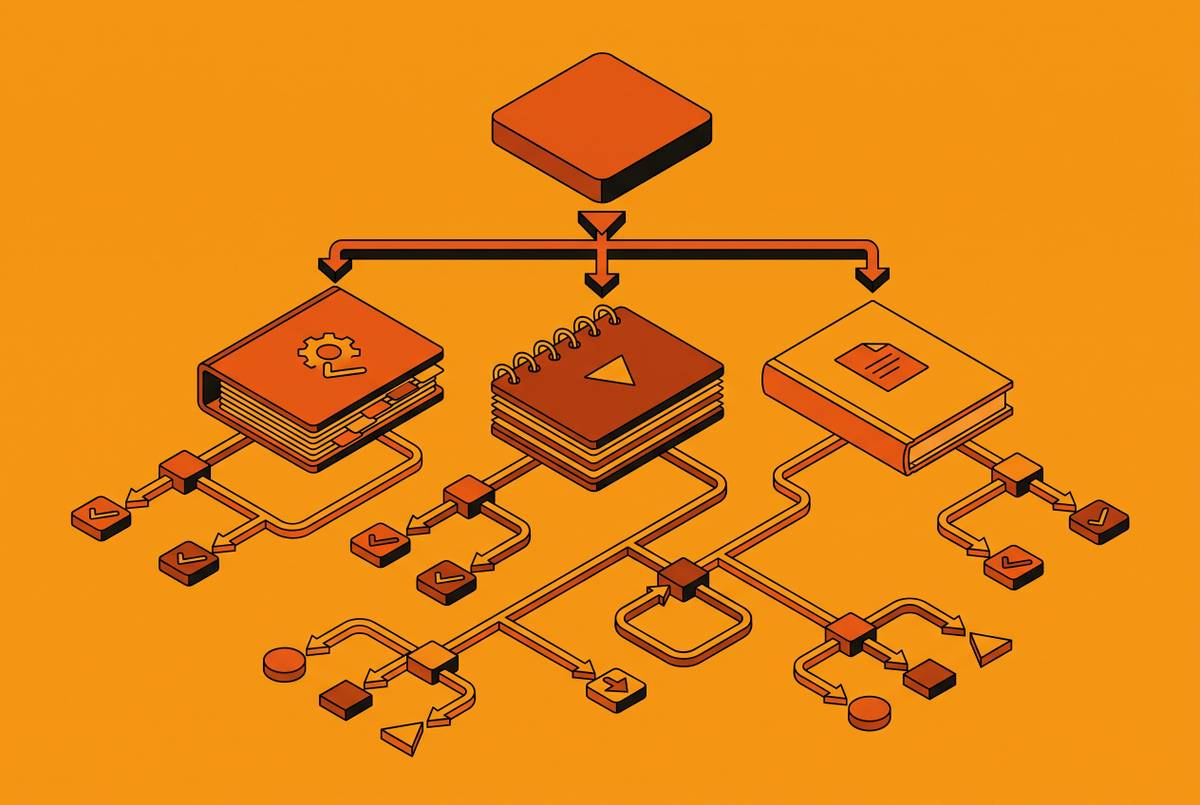
Canary analysis adds a second layer, so it's worth walking through step by step to see how the mechanics work. At each traffic milestone, the platform checks automated health gates before allowing the rollout to expand further. If a gate fails at the canary stage, the pipeline pulls the new version out of rotation and routes all traffic back to the stable release automatically, without a human having to notice anything first. Most users on the stable path never experience the regression. The on-call engineer who does get notified receives a diff of the specific metrics that triggered the rollback, not a blank war-room page with no starting point for investigation.
The part of this most teams underinvest in is the CI/CD integration itself. The pipeline has to emit deployment events, commit SHA and timestamp, as telemetry annotations, and it has to confirm observability instrumentation is actually working after the deploy before it's allowed to call the release successful. Skipping that step leaves the rest of the verification architecture with nothing reliable to compare against.
The stakes on both mechanisms go up with agentic and AI-generated code, because errors compound across multi-step automated processes in a way that punishes any missing gate. GraphFlow's architecture paper lays out the math: under an idealized model where each step is independent, a ten-step workflow running at 90% reliability per step completes successfully only about 35% of the time. That compounding effect is why automated gates at each stage of a pipeline stop being optional once a meaningful share of code is agent-generated or agent-modified. It also raises a separate question: the gates themselves are only as good as the telemetry feeding them, and that telemetry has gaps most teams don't know about until it's too late.
Where instrumentation gaps silently break verification
A verification platform is only as reliable as the data it reads, and most stacks have blind spots in exactly the places where a deployment regression is most likely to hide.
The underlying issue, in distributed systems, is that a single user-facing request often touches many services, and the older style of monitoring, isolated dashboards, siloed log files, can't answer the one question that matters: where in that chain did the request actually fail, and why. Post-deploy verification has to answer that question, and it can't if the trace breaks somewhere along the path.
Several blind spots recur: async boundaries are one, where message queues and event buses don't carry trace context the way HTTP requests do automatically. Business logic is another: auto-instrumentation reliably captures database calls and HTTP requests, but it has no built-in concept of a business process like "processing a payment" or "running a fraud check." Regressions inside that logic stay dark unless someone has manually instrumented those spans. OpenTelemetry has introduced semantic conventions specifically for GenAI workloads, letting teams trace token usage and model parameters, and, on an opt-in basis for content capture, the prompt interactions themselves, inside the same distributed traces used for everything else.
OpenTelemetry matters here because it's a structural answer, not just a convenient library. It's a CNCF graduated project, so you get a vendor-neutral framework that cuts down on instrumentation lock-in, and telemetry can move across verification tools instead of staying stranded in one vendor's format. None of this is a reason to treat instrumentation as solved once a verification tool is installed. Fixing these gaps is a prerequisite for the verification layer to mean anything.
Automated incident response when verification catches a regression
Catching a regression quickly is only half the problem. What happens in the minutes after detection decides whether the team actually gets time back or just trades a slow page for a fast one.
For most teams, the real gap sits between detection and a reviewed, actionable fix, not in detection speed. An alert that fires within seconds of a regression but still requires hours of manual log-digging and war-room back-and-forth hasn't solved the underlying toil problem, it's just moved the clock start earlier. Automated root-cause analysis changes that time profile directly: instead of an engineer starting a diagnosis from zero, an agent reads the alert, pulls the relevant traces, checks deployment history, compares current behavior against the prior baseline, and surfaces a likely cause for a human to review.
Production data from Kuaishou illustrates what that shift looks like at scale. Kuaishou's internal agentic root-cause-analysis system, built on their Tianwen monitoring platform, was evaluated across 483 system-related emergency incidents from October 2025 through March 2026. The system correctly identified the root-cause service and failure type in the large majority of those incidents, and it cut the average time to localize root cause by 77.3% over that window, down to an average of 11.8 minutes. That's a concrete measure of what you save when you automate the diagnosis step, not just the detection step.
The output worth aiming for is a reviewed fix pull request routed back to the responsible engineer, instead of an open-ended Slack thread with no clear owner and no attached remediation. Continuous verification tools like One Patch specialize in exactly this second category, automated pass/fail decisions scoped to a rollout, comparing pre- and post-deploy telemetry, correlating the code diff against runtime signals, and surfacing the likely blast radius so a team can decide quickly whether to keep going or roll back.
One caveat matters specifically for agentic systems: rolling back the model isn't enough on its own. An agent that has already posted an API request, written a row to a database, or sent a notification has produced side effects that persist no matter what happens to the model afterward. Verification and rollback gates need to sit before those irreversible actions are taken, applying the same canary-gate logic from earlier to a case where the usual rollback safety net doesn't fully apply.
Platforms that automate post-deploy verification
Picking a platform comes down to two questions: where the team's deployment stack actually lives, and how much of the loop, detection, diagnosis, fix, the team wants closed automatically versus handed to a human partway through.
One Patch is built for backend and platform engineering teams who want that full loop, verification, root-cause analysis, and fix PR generation, closed together in one place. It sits between the pull request stage and the live production environment, and it verifies every PR against real telemetry once it deploys. The goal is to catch regressions before a human has to be paged at all, and when something does break, it opens a fix PR on its own, so the engineer's job shifts from diagnosing a problem from scratch to reviewing a proposed fix. That matters most if you ship at a fast, often agent-assisted pace, because you can't realistically review every change by hand after it deploys given the volume.
The choice between them comes down to scope. A team that needs the full loop closed, from verification through to a fix PR, and that ships at high velocity or with a meaningful share of AI-generated code, gets the most value from an integrated approach like One Patch, because it removes the handoff delay that sits between detection and remediation. Instrumentation portability is the baseline a platform needs to meet before it's worth evaluating.
Why automated verification is not a velocity tax
The usual objection to adding a verification step is that it slows shipping down. In practice, automated verification removes toil that was already slowing the team down, just in a form that wasn't showing up on anyone's dashboard.
Speed and reliability only trade off against each other when you verify by hand. One Patch embodies this distinction directly: it treats deployment and verification as separate acts, automatically checking every PR against live production telemetry after the release lands, so a green pipeline never gets mistaken for a healthy production system on its own.
The cost of skipping verification never appears in deployment time metrics, so it is easy to underweight in a planning conversation. None of that appears in a sprint velocity chart. All of it appears eventually in engineer retention numbers and in whether a team actually hits its reliability SLOs. Counted honestly, the choice is between paying the cost of verification upfront, in a canary gate and a baseline comparison, or paying it later, in burnout and in the regressions nobody caught until a customer did.