Runbook Example for a Database Connection Exhaustion Incident
Distinguish three root causes of connection pool exhaustion to reach the right fix faster.
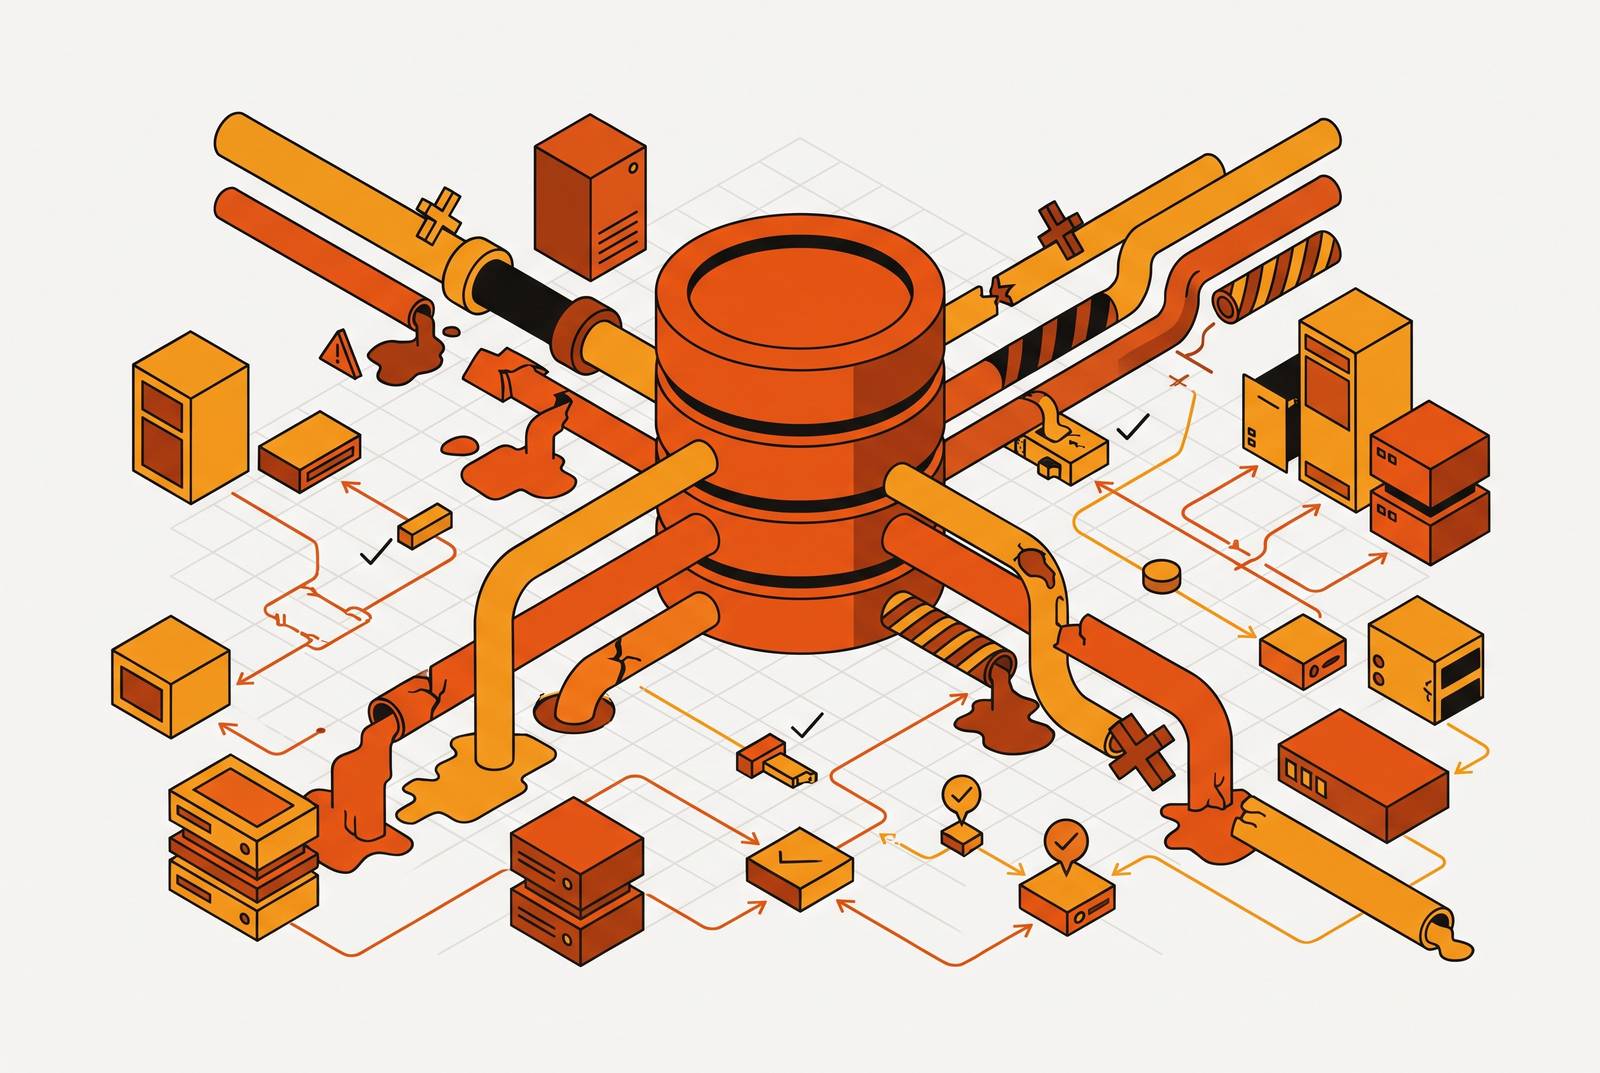
A shared connection pool means shared fate. When one workload breaks, it can deny database access to every other service sitting on the same pool, and keep denying it long after the workload that caused the trouble has stopped running. Lock waits slow a query down. Disk full stops writes to one table or one database. Replication lag delays reads on a replica. Connection exhaustion can take down an entire platform, because the pool is the single gate every service walks through to reach the database, and once that gate is jammed, nothing gets through, no matter how healthy its own code is.
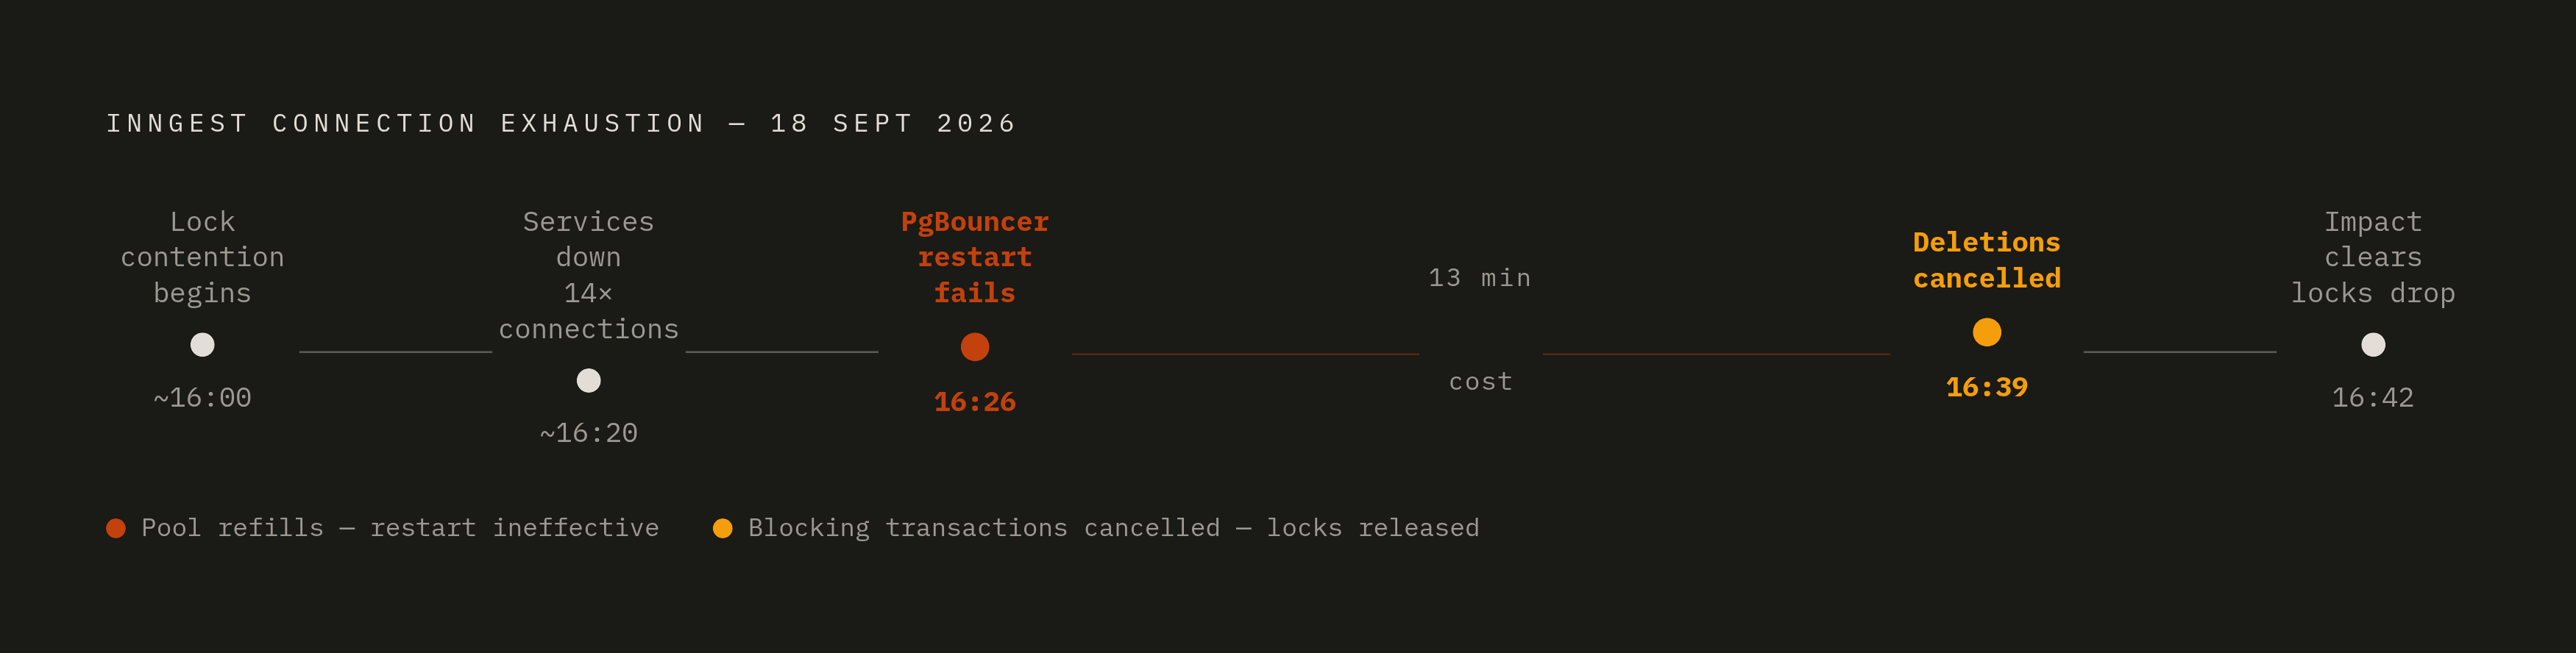
The Inngest incident of September 18, 2026 shows how far the damage can spread. Lock contention tied to an account deletion saturated PgBouncer, and the fallout took down run scheduling, event acknowledgement, the Connect gateway, and the Constraint API, none of which had anything to do with the deletion itself. That's the signature of connection exhaustion: the services that go down are often innocent bystanders, failing only because they happened to share a pool with the service that broke. Worse, the pool doesn't recover on its own schedule. PgBouncer did not recover when the database did: the queue of waiting clients sat there untouched, a restart attempted at 16:26 failed outright because the blocking transactions were still running and the pool simply refilled, and recovery only arrived once the queued deletions were actively cancelled at 16:39 to release the locks. A database incident that fixes itself once the trigger clears is a different animal than one that requires a second, deliberate intervention to unwind. So connection exhaustion gets its own runbook, one built around root cause, not symptoms.
The three root cause mechanisms that a connection exhaustion runbook must distinguish
If a runbook treats connection exhaustion as a single category, it produces a single generic checklist: restart this, bump that number, and hope. If the three mechanisms behind pool exhaustion don't share a cure, a runbook built around them gives the on-call engineer a decision tree that reaches the right fix faster.
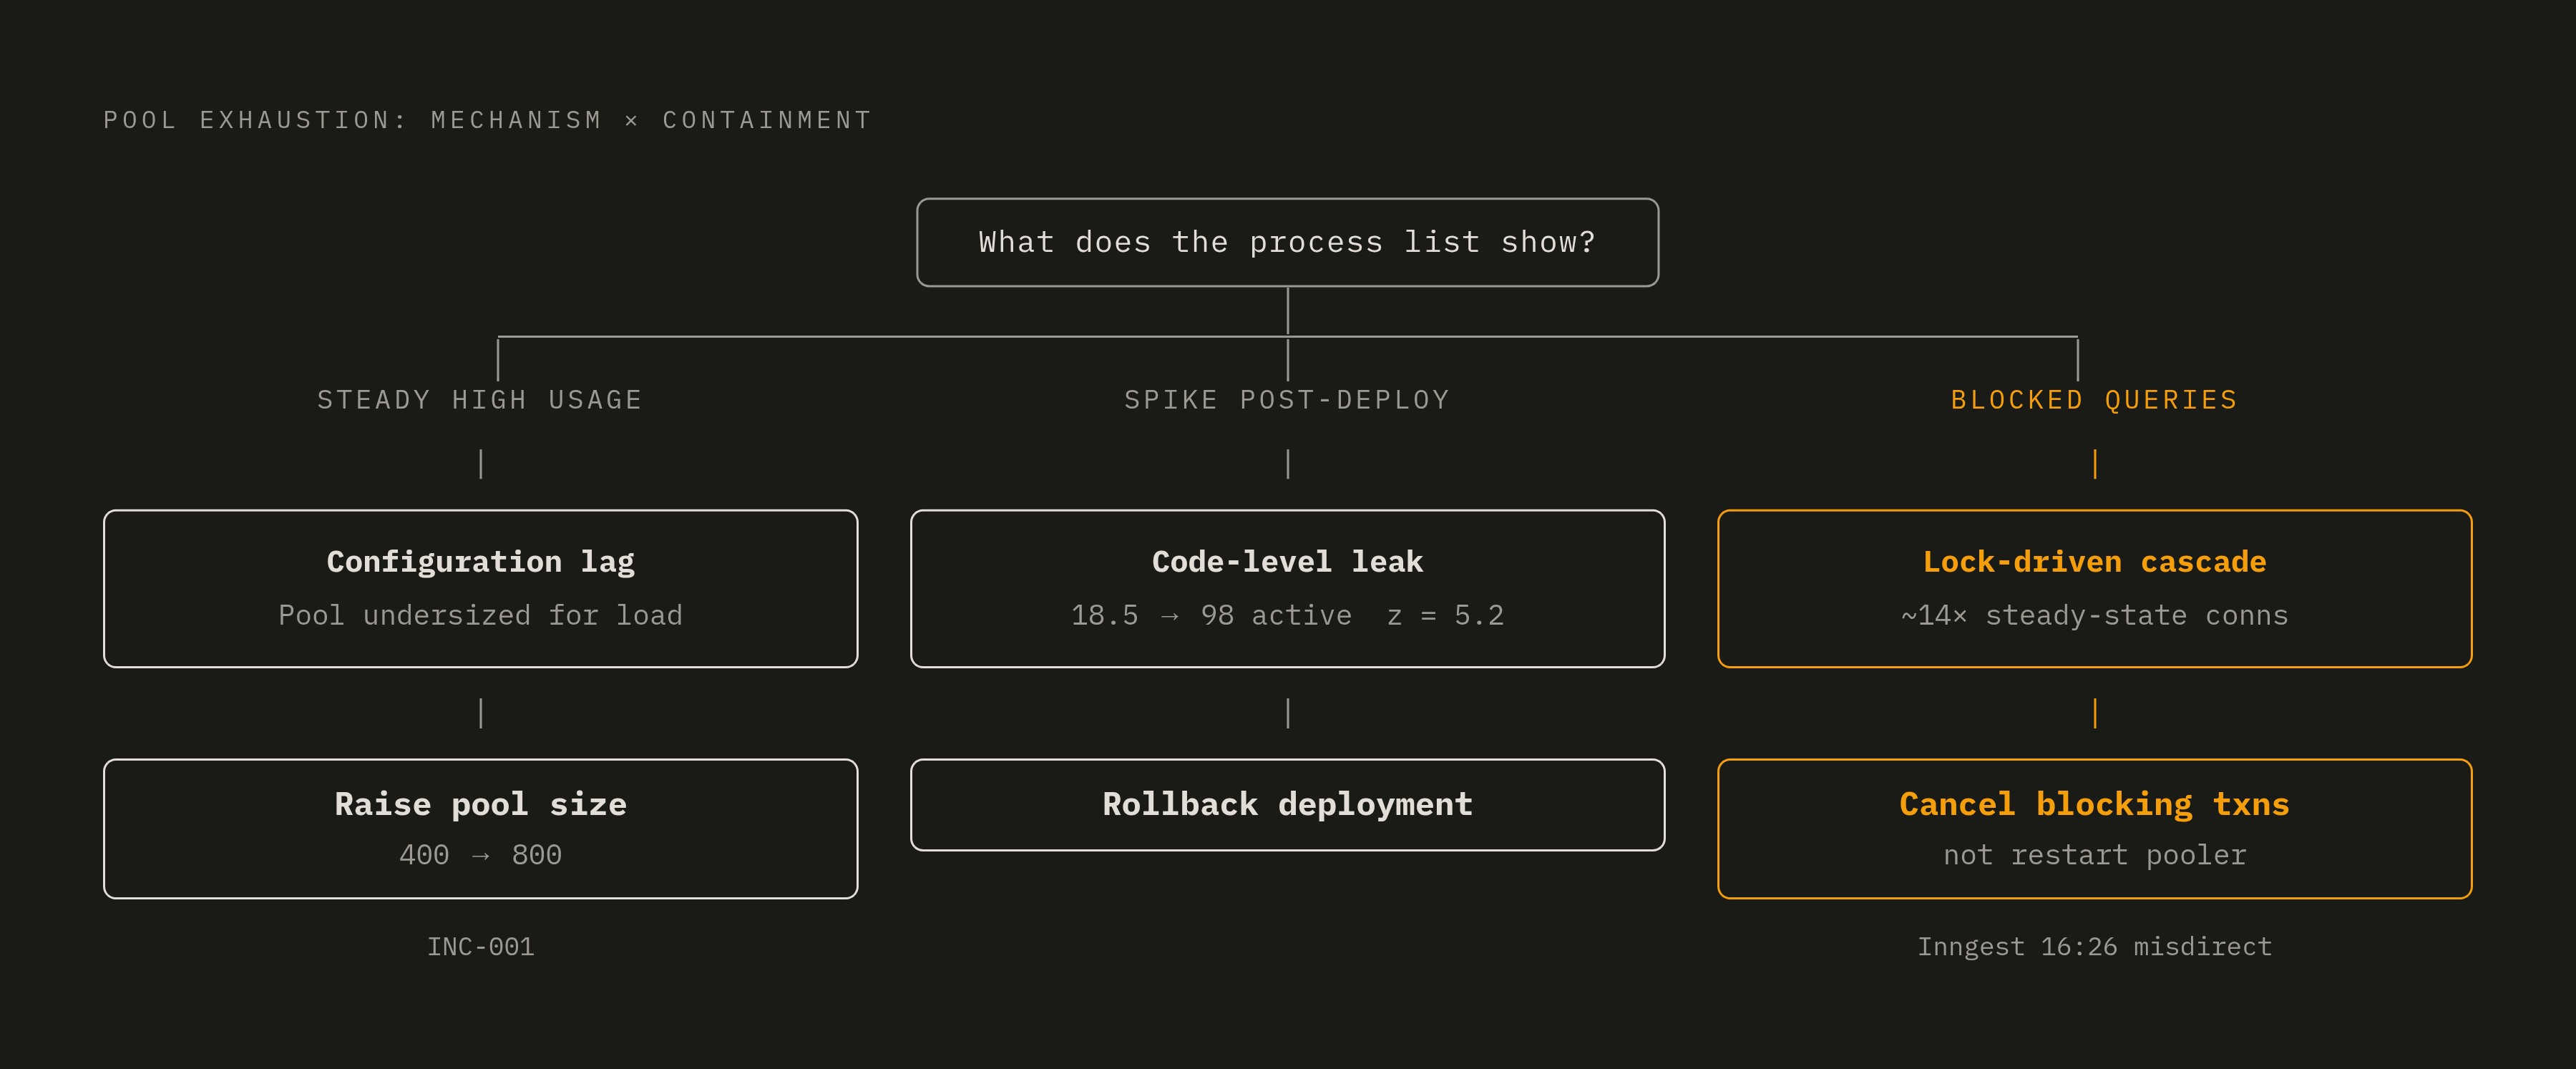
Mechanism 1 is configuration lag: the pool was sized for a traffic level the system has since outgrown, or a configuration change shrank the pool without anyone checking it against current load. This pattern appears most often right after a traffic spike, or after a change that nobody paired with a load review. The INC-001 payment SEV-2 incident is a clean example: the root cause was simply insufficient pool size relative to concurrent load, and the fix was raising that size. The follow-up confirmed the fix held: the pool went up from 400 to 800 connections, and the service recovered, as shown by HTTP requests that ran successfully at low latency afterward.
Mechanism 2 is a code-level leak: new code fails to close connections it opens, or a configuration change quietly shrinks the pool, and the symptom lands immediately after a deployment goes out. The IncidentDNA report on order-service names this mechanism as the most likely cause: connection leaks from missing close calls, or a configuration change that reduced pool size, with active connections spiking from a baseline of 18.5 to 98 (z-score 5.2) and triggering 156 timeout errors.
Mechanism 3 is a lock-driven cascade: a blocked query doesn't release its connection while it waits, so it keeps holding a slot in the pooler for as long as the wait lasts, and lock contention on even a small number of tables can turn into total pool exhaustion for every service that shares that pool. The Inngest incident is the clearest case on record. Repeated deletion attempts queued up behind a long-running first deletion transaction, itself a cascading hard-delete, and each queued attempt held onto a PgBouncer client slot the entire time it waited, pushing client connections to roughly fourteen times their steady-state level, almost all of them doing nothing but sitting in line.
These three mechanisms don't just differ in cause. They differ in what fixes them. The diagnostic steps that follow are built to route the engineer to one of these three branches as early as possible.
Why a deceptive symptom profile delays diagnosis
The hardest part of a connection exhaustion incident is that the obvious signals point the engineer in the wrong direction. In the same snapshot you can see high error rates next to low average latency and a request rate near zero, because requests fail the instant they try to grab a connection, not partway through a slow query. So an engineer trained to chase latency spikes looks at that dashboard and misses the exhaustion unfolding beneath it, caused by connections failing instantly rather than queries running slowly.
Liveness checks make this worse. The application process is running, so the health check passes, even when the pool behind it is fully exhausted and can't serve a single new request. That gap between "the process is alive" and "the database layer is usable" can cost minutes of SLO budget at three in the morning, when the engineer's first instinct is to trust a green health check over a hunch about the connection layer.
The Inngest incident demonstrates the cost of acting on the wrong read of the situation. The first PgBouncer restart, attempted at 16:26, failed to resolve anything because the blocking transactions it depended on were still running, and the pool simply filled back up, a direct result of attempting a fix before the lock-driven cascade had been identified as the actual mechanism at work. That's the argument for starting the diagnostic sequence at the connection layer rather than at application logs or infrastructure dashboards: the surface symptoms lie, and only the pool and the process list tell the truth about what's actually happening.
Severity classification and initial orientation before touching anything
A team has to classify severity before it runs a single diagnostic command, because if it misjudges a P1 as a P3, it loses SLA compliance before diagnosis has even started. A pool fully saturated, new connections refused outright, and multiple services affected calls for SEV-1 or P1 treatment: acknowledge immediately and escalate within minutes. Pool utilization sitting at a critically elevated level, with errors climbing and a single service degraded, calls for SEV-2 or P2: page the primary on-call and start the runbook. Pool utilization above threshold but the service still responding calls for SEV-3 or P3: acknowledge promptly and investigate without paging anyone in yet. If there's any doubt about which bucket an incident belongs in, push the classification upward: standing down an over-called P1 costs far less than scrambling a team together after an under-called P3 turns into data corruption.
Triage is not diagnosis. The job of the first five minutes is to take a baseline snapshot of what the system is doing right now, not to produce a fix. That distinction matters because the instinct to act fast runs directly against it: killing connections or restarting a service before understanding what the system is actually doing is exactly the mistake the Inngest incident illustrates, where restarting PgBouncer before the blocking transactions were cancelled accomplished nothing and the pool refilled within minutes. The deployment correlation check belongs in this early orientation phase for a specific reason: it is the one step that separates a connection exhaustion runbook from a generic database incident runbook, because it asks whether the exhaustion lines up with a code release rather than with traffic growth or a lock. If that correlation gets on the table early, before the deep diagnostic steps begin, it shapes which of the three mechanisms the rest of the investigation should expect to confirm.
The diagnostic sequence: reading the connection layer before anything else
Every investigation into connection exhaustion starts at the pool and the database process list, in that order. Application logs and infrastructure metrics stay secondary until the connection picture is clear, because those signals describe symptoms of the pool's state, but not its cause.
Step 1 establishes pool state. On MySQL, run SHOW VARIABLES LIKE 'max_connections';, SHOW STATUS LIKE 'Threads_connected';, and SHOW STATUS LIKE 'Connection_errors_max_connections';. On PostgreSQL, query pg_stat_activity filtered to non-idle connections, checking the wait_event_type and wait_event columns, which are the branch point for Mechanism 3. A connection headroom query, drawn from jusdb's 2026 runbook, joins pg_stat_activity with pg_settings for max_connections and superuser_reserved_connections to compute available connections directly, rather than estimating headroom by hand. Where PgBouncer sits in front of Postgres, its client connection count gets checked separately from the database's own connection count, since the Inngest incident shows that the pooler can be fully saturated while the database underneath it is nowhere near its own limit.
Step 2 reads the process list for wait events. On MySQL, you can run SHOW FULL PROCESSLIST;, or query information_schema.processlist filtered to exclude the Sleep command and sorted by runtime in descending order. On PostgreSQL, pull pg_stat_activity ordered by query_start ascending, checking the state and wait_event columns for each row.
This is the branch decision, and it decides which section of the runbook to open next. If the longest-running queries show wait_event_type = 'Lock' on Postgres, or state = 'Locked' on MySQL, the investigation routes to Mechanism 3, the lock-driven cascade. But if connections instead sit mostly idle or in a sleep state while the pool itself is near its max, you route the investigation to Mechanism 1 or Mechanism 2.
Step 3 checks deployment correlation. If the process list shows a leak pattern, connections piling up without any long-running queries to explain them, check kubectl rollout history for any deployment in the last two hours. A deployment timestamp that lines up with the onset of the connection climb is strong evidence for Mechanism 2.
Step 4 identifies which user or host holds the largest share of connections. On MySQL, group information_schema.processlist by user and host, ordered by count descending. On PostgreSQL, group pg_stat_activity by application_name or client_addr. This step reveals whether a single service is monopolizing the pool, the same blast-radius signal captured in the IncidentDNA pattern where order-service held connections that cascaded into inventory-service, payment-service, and notification-service.
Containment actions mapped to each root cause mechanism
Containment differs by mechanism, and applying the wrong one wastes time at best and worsens the incident at worst. The Inngest PgBouncer restart is the clearest case of a reasonable action taken before root cause was confirmed, and it bought nothing.
For Mechanism 1, configuration lag from an undersized pool, the immediate move is an emergency increase to pool size. The INC-001 payment SEV-2 remediation took this path: it raised the pool from 400 to 800 connections and confirmed recovery through successful HTTP requests running at low latency afterward. Raising pool size can paper over an underlying inefficiency unless someone follows up with a monitoring pass once the immediate fire is out. Alongside the size increase, idle connections above an age threshold can be cleared to drain the queue while the configuration change takes effect. On MySQL, generate KILL CONNECTION statements from information_schema.processlist where command = 'Sleep' and time > 60. On PostgreSQL, the equivalent is pg_terminate_backend() targeted at idle connections above that same age threshold.
For Mechanism 2, a code-level leak surfacing after deployment, rollback is the first option to reach for. The IncidentDNA P1 order-service runbook rates rollback as low risk and places it first on the list: run kubectl rollout undo deployment/order-service -n production, then confirm with kubectl rollout status deployment/order-service -n production under an appropriate timeout. If rollback isn't immediately safe to execute, you force a pod restart to release held connections in the meantime, through kubectl rollout restart deployment/order-service -n production, and watch active connection counts through kubectl exec against the application's metrics endpoint. An emergency pool size increase remains available as a medium-risk secondary action if rollback is blocked, but it stands in as a stopgap, not a substitute for the rollback itself. Closing out this mechanism calls for the same gate IncidentDNA's resolution checklist lays out: root cause confirmed by the on-call engineer, the fix verified in staging, the fix deployed to production, health metrics back at baseline, and every service in the blast radius confirmed healthy before the incident gets closed.
For Mechanism 3, the lock-driven cascade, the first instinct to resist is restarting the pooler. The Inngest incident makes the cost of that instinct explicit: PgBouncer was restarted at 16:26, the pool refilled immediately because the blocking transactions were still running underneath it, and the impact didn't clear until 16:42, once lock counts dropped following the cancellation of the queued deletions at 16:39. The correct first move is identifying the blocking transaction itself. On PostgreSQL, you query pg_stat_activity for the oldest query sitting in a lock-wait state. On MySQL, run SHOW ENGINE INNODB STATUS\G to find the lock holder directly. Once that transaction is identified, the decision becomes whether to cancel it and clear the lock, a judgment call that depends on what the transaction is doing and what cancelling it will cost downstream, but one that has to be made before the pooler gets touched again.
Sources
- Database Incident Response Runbook: From Alert to Resolution
- [P1] order-service — Deployment-induced database connection pool exhaustion in order-servic · Issue #30 · theshubh007/FortressAI_AI_Agent_Security_Platform
- [SRE Incident] INC-001 - payment - SEV-2 · Issue #19 · harwinder766/ai-sre-incident-triage-agent
- [SRE Incident] INC-001 - payment - SEV-2 · Issue #30 · harwinder766/ai-sre-incident-triage-agent
- Incident report for September 18, 2026 - When Deletion Cascades Exhausted Our Database Connections - Inngest Blog